Super-resolution Benthic Object Detection
2024-03-11
Per Halvorsen
GitHub
LinkedIn
In our last notebook, we evaluated MBARI's Montery Bay Bethic Object Detector on the external out TrashCAN dataset. There, we found that model results were good, given the slight adaptations we made to compare against the new annotaitons. However, we also saw potential for increased model performance when applying some types of upscaling to the input images.
In this note, we will build a workflow to easily feed the inputs from the TrashCAN dataset through a super-resolution (SR) layer before feeding them into the MBARI model. We then evaluate the performance of the model with and without the SR layer to see how much, if any improvement we can achieve. It will also be important to measure copmutation time and memory usage, as some of the SR models we test are quite complex.
Before diving into the code, we will first dicuss our motivations for applying a super-resolution layer to the input images, along with some fundamentally different architectures useful for SR. Specifically, we will look at GANs, Transformers, and the more traditional CNN-based SR models.
In later notes, we can explore fine-tuning the set-up built here. This is important to keep in mind when making decisions about our implementations of the super-resolution modules.
Setup
In this section we set-up the development environment, for readers who want to reproduce the results in this note. If you are just interested in reading about the experiment, jump to the next section.
Install dependencies
Uncomment the following line if you haven't already installed this repo's requirements.
# %pip install -r ../requirements.txt
Temporary note
The basicsr library has a small bug that break imports. There is luckily a quik fix for this found here, thanks to Th3Rom3.
The fix is to change line 8 in basicsr/data/degradations.py file from:
from torchvision.transforms.functional_tensor import rgb_to_grayscale
to:
# from torchvision.transforms.functional_tensor import rgb_to_grayscale
from torchvision.transforms.functional import rgb_to_grayscale
This is easily done by drilling into the module in the import below, by holding done ctrl (Windows) or command(Mac) and clicking on the import. If you are using a Linux system, you probably know how to update this on your own machine.
Then, we can change the line and save the file.
# import basicsr.data.degradations
Imports
# %load_ext autoreload
# %autoreload 2
from fathomnet.models.yolov5 import YOLOv5Model
from IPython.display import display
from pathlib import Path
from PIL import Image
from PIL import ImageOps
from pycocotools.coco import COCO
from torch.profiler import profile, record_function, ProfilerActivity
from typing import List, Union
import cv2
import json
import numpy as np
import onnxruntime
import os
import torch
# ABPN imports
from tqdm.auto import tqdm
# ESRGAN imports
from basicsr.archs.rrdbnet_arch import RRDBNet
from realesrgan import RealESRGANer
Paths
root_dir = Path(os.getcwd().split("personal/")[0])
repo_dir = root_dir / "personal" / "ocean-species-identification"
data_dir = root_dir / "data" / "TrashCAN"
models_dir = root_dir / "personal" / "models"
HAT model imports
We need to load the HAT architecture from the repo itself. To do this, we need to have the repo locally, and load through pip. We baked this into a script scripts/get_hat.sh.
!source $repo_dir/scripts/get_hat.sh $repo_dir
from hat.archs.hat_arch import HAT
Reuse code from previous notebook
# reuse some code from preivous notebook ported to src.data
os.chdir(repo_dir)
from src.data import images_per_category
from src.evaluation import evaluate_model
Load
We will start by loading the TrashCAN dataset, the MBARI model, and label map between the two. Aside from path building, each requires only a single line of code to load.
benthic_model_weights_path = models_dir / "fathomnet_benthic" / "mbari-mb-benthic-33k.pt"
benthic_model = YOLOv5Model(benthic_model_weights_path)
trashcan_data = COCO(data_dir / "dataset" / "material_version" / "instances_val_trashcan.json")
benthic2trashcan_ids = json.load(open(repo_dir / "data" / "benthic2trashcan_ids.json"))
Using cache found in /Users/per.morten.halvorsen@schibsted.com/.cache/torch/hub/ultralytics_yolov5_master YOLOv5 🚀 2024-3-16 Python-3.11.5 torch-2.2.1 CPU Fusing layers... Model summary: 476 layers, 91841704 parameters, 0 gradients Adding AutoShape...
loading annotations into memory... Done (t=0.04s) creating index... index created!
# benthic_model._model.eval()
Super resolution model
In our first notebook, we mentioned a super-resolution model that could possibly help the Benthic Object Detector perform better on our held out dataset. The architecture used here was a PyTorch implementation of the Anchor Based Plain Net for Mobile Image Super-Resolution model, which is a light-weight CNN-based archtiecutre. In this section, we will explore this and other types of super-resolution models, including the Enhanced Super Resolution GAN and Hybrid Attention Transformer, to see if they can help improve model performance.
Background
Motivation
The general idea with this setup is that if we can enhance some of the low-level, fine-grained patterns in the images, the larger picture may be easier to interpret for the model.
The Benthic Object Detector is trained from a YOLOv5 backbone. This architecture contains a deep stack of convolutional layers, making it good at picking up low-level features, such as edges and textures, in its first few layers. The deeper CNN layers are then able to piece these features together to produce high-level predictions about the full objects in the image, as done in object detection. A super-resolution preprocessing would then aim to enhance the low-level features to make them more clear for the Benthic model to better work its math-magical caluations on.
Convolutions
Breifly explained, convolutional layers apply a filter to a sliding window of the input pixels, before pooling, allowing the strongest signal from each "glimpse" to pass through. The more filters a model has, the more flexibility it has to "focus" on different patterns or features in the inputs. This is essential for upscaling, since the model will need to learn to correctly predict the values of the new pixels it adds to the image.
Inputs are often split into a number of channels, which can be thought of as "slices" of the input image, like RGB layers. A convolutional filter will then also have the same number of channels, with tunable parameters for each one.
In the animation below, we can see eight 3x3 convolutional filters applied to a 7x6 input already split into 8 channels.
Check out this great visualization of convolutions from Animated AI on Youtube
The results of the matrix multiplication between the filter and the input are then pooled to produce a single value in the output. This means outputs sizes vary greatly depending on the size of the input, filter, stride, and dialation. As you can see, the more filters you have, the more layers of features you get in your outputs.
Super-resolution models
We previously made use of the Anrchor-Based Plain Net model as our inital upsampler due to its light-weight architecture and ease-of-use. Other models exist that are more complex, trained for SISR, or single-image super-resolution. These don't consider computional cost as much, and instead focus on performance. In this note, we consider a few hand-picked models to measure any performance differences between architectures and complexity levels.
Model size is only one of many factors to take into account when choosing a computer vision model.
There are also a few different base components to consider, each with their own strengths and empircal relevance.
Some emphasize full-image context, others emphasize local features and flexibility.
The base architectural components we breifly look into here are: GANs, CNNs, and Attention.
The papers for the following architectures can be found in the research/ folder.
ABPN: Anchor-based Plain Net for Mobile Image Super-Resolution
This is the model we used in our first notebook, via this playground. As an 8INT quantized model, the SR Mobile PyTorch model is aimed to be as small, yet efficient, as possible, in order to run on mobile devices. It can "restore twenty-seven 1080P images (x3 scale) per second, maintaining good perceptual quality as well." In other words, it is fast and computationally cheap.
The ABPN architecture makes use of convoultions, residual connections, and a pixel shuffle layer.
A residual connection is a way to "skip" a layer in a neural network, sending an untouched version of the input to a later layer, to preserve the original signal. In super resolution, this would help the model maintain important features of the input when upscaling the image. Various architectures make use of residual connections rather differently, sometimes in very complex manners. The ABPN model however, uses a simple residual connection, as seen in the image below.
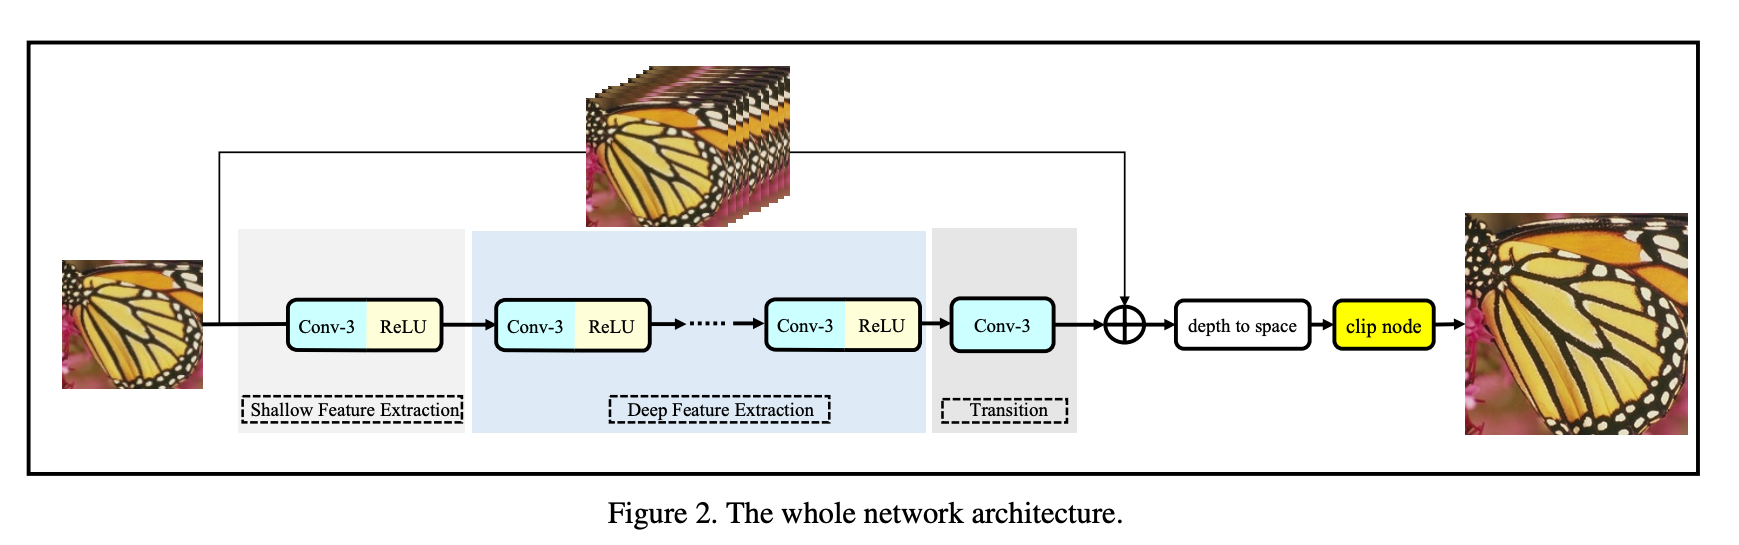
Notice one of the last layers called "depth to space". This is a pixel shuffle layer, which is a way to upscale the input by rearranging the pixels in the input. This component leverages the features extracted by the upstream CNN layers to predict the values of the final pixels in the output image. Animated AI has another great visualization to explain this concept.
The model we will use here is a PyTorch adaptation of the original model, which was written in TensorFlow. According the to SR Mobile PyTorch GitHub, the architecture was ported as is, with minimal changes. We opted for the PyTorch version of this architecture, since it was easier to use out-of-the-box, and because PyTorch subjectively easier to work with.
ESRGAN: Enhanced Super-Resolution Generative Adversarial Networks
Published as a state-of-the-art super resolution model in 2018, the ESRGAN is much more complex than the previous model.
It was trained using a generator-discriminator network, similar to SRGAN with a 19 layer VGG network as the generator.
Including this model in our evaluation will allow us to observe the difference larger models can make in performance.
Below, we see an outline of the SRGAN architecture, the parent model of ESRGAN.
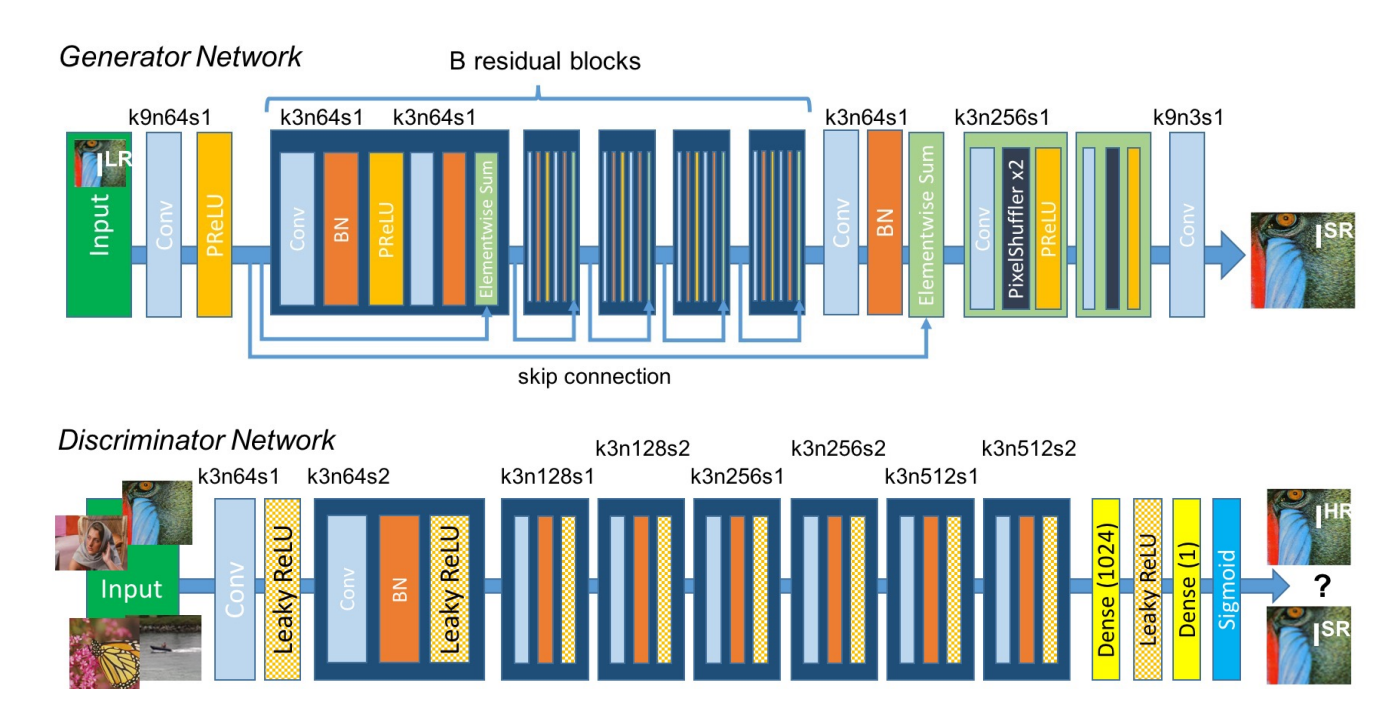
Two major changes from the SRGAN model were made to the generator in ESRGAN:
1. They removed batch normalization inside the dense blocks.
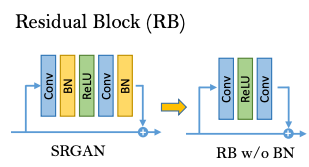
Batch normalization is a technique used to normalize the outputs of an upstream component based on the other examples in the batch, which can improve generalization and avoid overfitting.
The paper's reasoning behind removing this layer was that batch normalization can introduce artifacts during evaluation, since the model is using an estimated mean and variance for the normalization from the training. This becomes a problem in data sets where training and test sets can vary quite a lot.
Additionally, empirical observations have shown that removing batch-normalization increases generalization and performance, while lowering computational cost.
2. They introduced Residual-in-Residual Dense Block (RRDB).
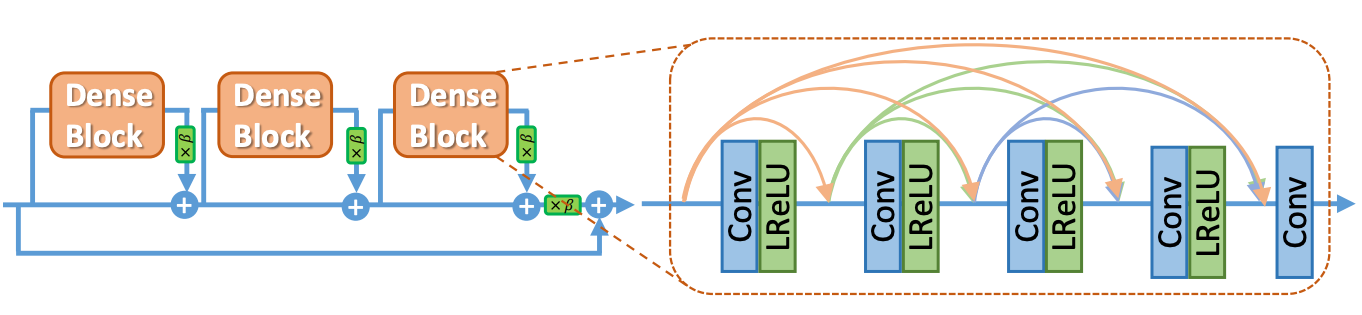 Connecting all layers through residual connectors is expected to boost perforamnce, as it allows the model to learn more complex features.
This is the opposite extreme of the ABPN model, which uses a single residual connection.
Connecting all layers through residual connectors is expected to boost perforamnce, as it allows the model to learn more complex features.
This is the opposite extreme of the ABPN model, which uses a single residual connection.
There has been other work on multilevel residual networks (Zhang et. al 2017) that have shown to improve performance greatly in a range of computer vision tasks. It is however important to keep in mind that this added complexity will also increase the required compute resources. If we were to fit our pipeline into the head of an underwater ROV, we really need to balance the tradeoff between performance and computational cost.
Some other key improves of the ESRGAN from previous architectures include:
- Relativistic discriminator: predicts a probability of an image being real or not, rather than a binary decision.
- Refined perceptual loss: constraining (applying) the loss on the feature before activation functions to preserve more information.
- Introduce network interpolation: using a threshold to balancing two models: the fine-tuned GAN and a peak signal noise ratio model. This allows to easily balance quality of outputs without having to retrain the model.
(I am not sure if they removed the batch normalization from the discriminator as well, but can be looked into in their implementation on GitHub.)
HAT: Hybrid Attention Transformer for Image Restoration
Recently, Tranformer models have shown huge perform boosts in computer vision tasks, after their great success in NLP.
The Hybrid Attention Transformer is a hybrid model that combines both attention and convolutions.
It was published in late 2023, and currently holds the state-of-the-art title for most of the classic super-resolution benchmark datasets.
It builds off of other transformer based SR models such as Swin Tranformer and RCAN .
A transformer is a component of neural networks that uses cross- or self-attention.
Attention is a matrix multiplication that adds contextual information to the each token or pixel, through the use of queries, keys, and values.
The image below shows what this looks like in the context of language processing.
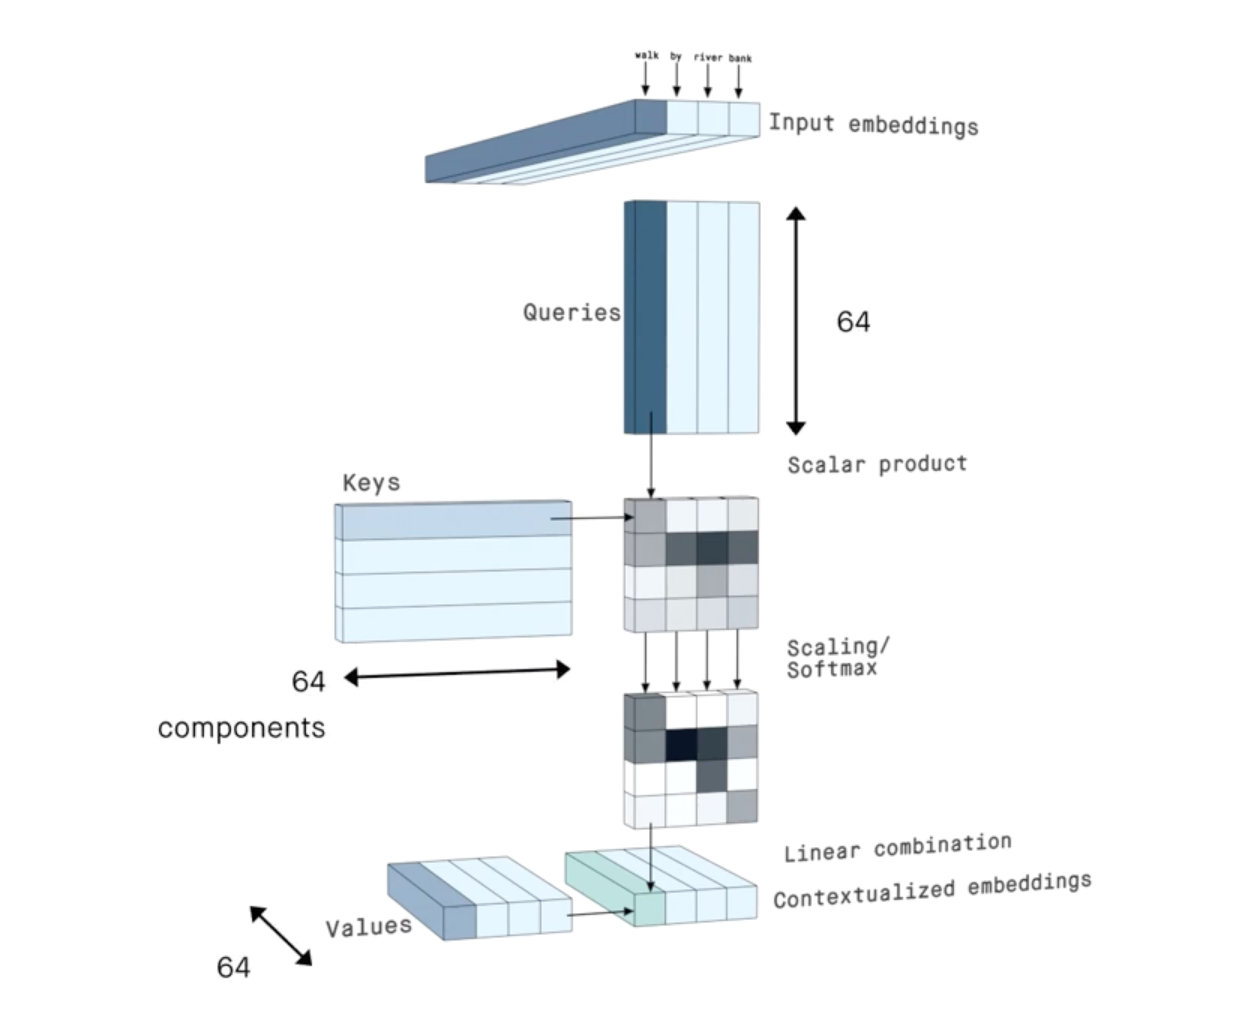
By Peltarion on YouTube
Building off the SwimIR model, the HAT model uses residual-in-residual connections, to propagate information through the network.
Residual in residual connections are some of the most complex skip connections, since they preserve the origianl signal at every smal step along the way, as well as at the end of the block.
As can be expected, this slows down data flow, but can also greatly improve performance.
The main components of HAT can be broken into three main parts:
- Shallow feature extraction: a few layers of convolutions that extract low-level features from the input.
- Deep feature extraction: a few layers of transformer blocks that extract high-level features from the latent, low-level features.
- Image reconstruction: a few layers of convolutions aimed to upsample the latent features to the scale of the final output.
In the image below, we see some of the main components of the HAT model, starting with a rough overview of the pipeline (a & b), followed by more fine-grained details of each of the blocks (c-f).
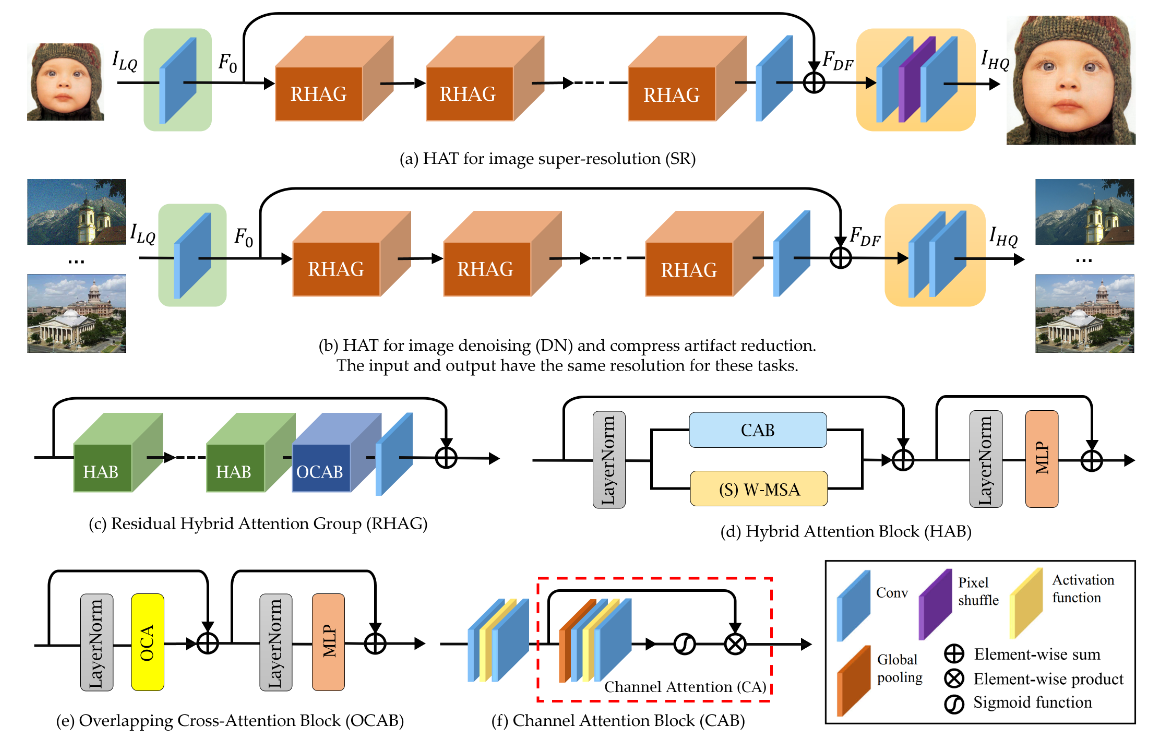
Borrowed directly from the white paper.
I'll save the details for the paper, but some of the key points are:
- Each residual hybrid attantion group (RHAG) contains a cross-attention block, a self-attention block, and a channel attention block.
- RHAGs also utilize a convolution as their final sub-layer, to help the transformer "get a better visual representation" of the input.
- Pixel shuffling is used in the upscale module, similar to the ABPN model.
- They introduce overlapping cross attention, meaning the windows of the attention blocks overlap. This differs from the original image transformer models, which used non-overlapping, same-sized windows for the queries, keys, and values.
The HAT model is yet another deep and complex model, with a large number of layers and parameters. This model is expected to perform well, but will also be quite slow at both inference and fine-tuning.
Our selection of models is not exhaustive, but it does cover a range of important topics within the field of computer vision and neural networks. Let's move on to the next stage, where we will implement the models and evaluate their performance.
Implementation
Now that we have a basic understanding of the few models we will look into, we are ready to load them into our environment and feed them our TrashCAN data.
Steps
For each model, we will execute the following steps:
- (single) feed image from COCO through SR models
- (single) feed outputs through MBARI model & show detections
- (full) wrap dataflow into a pipeline
- (full) run classification on a given category of TrashCAN images
Super resolution on a single image
To load in images for a particular category, we can reuse some logic from the previous notebooks ported to src.data.images_per_category.
# get only starfish images using src.data.image_from_category
starfish_images = images_per_category("animal_starfish", trashcan_data, data_dir / "dataset" / "material_version" / "val")
example_image_path = starfish_images[3]
example_image = Image.open(example_image_path)
print(np.array(example_image).shape)
display(example_image)
(270, 480, 3)

ABPN
# abpn_model_path = models_dir / "sr_mobile_python" / "models_modelx2.ort"
abpn_model_path = models_dir / "sr_mobile_python" / "models_modelx4.ort"
The following methods were adapted from the sr_mobile_python's inference module.
class ABPN(torch.nn.Module):
def __init__(self, model_path: str, store:bool=True):
self.model_path = model_path
self.saved_imgs = {}
self.store = store
def pre_process(self, img: np.array) -> np.array:
# H, W, C -> C, H, W
img = np.transpose(img[:, :, 0:3], (2, 0, 1))
# C, H, W -> 1, C, H, W
img = np.expand_dims(img, axis=0).astype(np.float32)
return img
def post_process(self, img: np.array) -> np.array:
# 1, C, H, W -> C, H, W
img = np.squeeze(img)
# C, H, W -> H, W, C
img = np.transpose(img, (1, 2, 0))
return img
def save(self, img: np.array, save_name: str) -> None:
# cv2.imwrite(save_name, img)
if self.store:
self.saved_imgs[save_name] = img
def inference(self, img_array: np.array) -> np.array:
# unasure about ability to train an onnx model from a Mac
ort_session = onnxruntime.InferenceSession(self.model_path)
ort_inputs = {ort_session.get_inputs()[0].name: img_array}
ort_outs = ort_session.run(None, ort_inputs)
return ort_outs[0]
def upsample(self, image_paths: List[str]):
outputs = []
for image_path in tqdm(image_paths):
img = cv2.imread(image_path, cv2.IMREAD_UNCHANGED)
# filename = os.path.basename(image_path)
if img.ndim == 2:
img = cv2.cvtColor(img, cv2.COLOR_GRAY2BGR)
if img.shape[2] == 4:
alpha = img[:, :, 3] # GRAY
alpha = cv2.cvtColor(alpha, cv2.COLOR_GRAY2BGR) # BGR
alpha_output = self.post_process(
self.inference(self.pre_process(alpha))
) # BGR
alpha_output = cv2.cvtColor(alpha_output, cv2.COLOR_BGR2GRAY) # GRAY
img = img[:, :, 0:3] # BGR
image_output = self.post_process(
self.inference(self.pre_process(img))
) # BGR
output_img = cv2.cvtColor(image_output, cv2.COLOR_BGR2BGRA) # BGRA
output_img[:, :, 3] = alpha_output
self.save(output_img, Path(image_path).stem)
elif img.shape[2] == 3:
image_output = self.post_process(
self.inference(self.pre_process(img))
) # BGR
self.save(image_output, Path(image_path).stem)
outputs += [image_output.astype('uint8')]
return outputs
abpn_model = ABPN(abpn_model_path)
abpn_upsampled = abpn_model.upsample([str(example_image_path)])[0]
abpn_upsampled.shape
0%| | 0/1 [00:00<?, ?it/s]
(1080, 1920, 3)
Image.fromarray(abpn_upsampled)

And double check the upsampled size of the image.
# check the scale of the super-resolution image
x_scale = abpn_upsampled.shape[1] / example_image.size[0]
y_scale = abpn_upsampled.shape[0] / example_image.size[1]
(x_scale, y_scale)
(4.0, 4.0)
ESRGAN
We can use the implementation of Real-ESRGAN from their GitHub.
That code was written to consider many pretrained variations of this architecture.
To increase readability, we strip this code down to expect only a single model variant, the RealESRGAN_x4plus (v0.1.0).
This can be downloaded from the Real-ESRGAN model zoo.
class ESRGAN(torch.nn.Module):
def __init__(
self,
model_name: str="realesr-general-x4v3",
model_dir: str="./",
tile=0,
tile_pad=10,
pre_pad=0,
half=False,
device=None
):
super(ESRGAN, self).__init__()
# model path and name
self.model_dir = model_dir
self.model_path = os.path.join(model_dir, model_name + '.pth')
self.model_name = model_name
self.check_model_present()
# RRDN parameters specific to pretrained model instance: v0.1.0/RealESRGAN_x4plus
self.model = RRDBNet(num_in_ch=3, num_out_ch=3, num_feat=64, num_block=23, num_grow_ch=32, scale=4)
# other model parameters
self.netscale = 4
self.tile = tile
self.tile_pad = tile_pad
self.pre_pad = pre_pad
self.half = half
# acutal sr module
self.upsampler = RealESRGANer(
scale=self.netscale,
model_path=self.model_path,
model=self.model,
tile=self.tile,
tile_pad=self.tile_pad,
pre_pad=self.pre_pad,
half=self.half
)
# realesrgan tries to cast to cuda, but not mps for Mac users
if device:
self.device = torch.device(device)
self.upsampler.device = torch.device(device)
self.upsampler.model = self.upsampler.model.to(torch.device(device))
def upsample(self, image_paths: List[str]):
outputs = []
for image_path in tqdm(image_paths):
img = Image.open(image_path)
img = np.array(img)
img = self.upsampler.enhance(img)[0] # 2nd dim not needed, specifies output type 'RGB
outputs += [img]
return outputs
def check_model_present(self):
# sanity check before proceeding
if not os.path.isfile(self.model_path):
raise ValueError(
f"Model {self.model_name} not found locally at \n" \
f"{self.model_path}. \n" \
"Download https://github.com/xinntao/Real-ESRGAN/releases/download/v0.1.0/RealESRGAN_x4plus.pth"
)
esrgan_model = ESRGAN(model_name="RealESRGAN_x4plus", model_dir=models_dir/"ESRGAN", device="mps") # mps to speed up inference on Macs
print(esrgan_model.upsampler.device)
mps
esrgan_upsampled = esrgan_model.upsample([example_image_path])[0]
print(esrgan_upsampled.shape)
Image.fromarray(esrgan_upsampled)
0%| | 0/1 [00:00<?, ?it/s]
(1080, 1920, 3)

HAT: Hybrid Attention Transformer for Image Restoration
Our implmentation of the HAT model is basically just a wrapper on top of the HAT module from the project repository. The wrapper allows us to call the model in a similar fashion to our other SR model implementations.
class Hat(torch.nn.Module):
"""
Config for the pretrained instance we are using found at:
https://github.com/XPixelGroup/HAT/blob/main/options/test/HAT_SRx4_ImageNet-pretrain.yml
"""
def __init__(
self,
weight_path: str = "HAT_SRx4_ImageNet-pretrain.pth",
upscale = 4,
in_chans = 3,
img_size = 64,
window_size = 16,
compress_ratio = 3,
squeeze_factor = 30,
conv_scale = 0.01,
overlap_ratio = 0.5,
img_range = 1.,
depths = [6, 6, 6, 6, 6, 6],
embed_dim = 180,
num_heads = [6, 6, 6, 6, 6, 6],
mlp_ratio = 2,
upsampler = 'pixelshuffle',
resi_connection = '1conv',
grad=False,
verbose=False,
device=None,
):
super(Hat, self).__init__()
self.model = HAT(
upscale = upscale,
in_chans = in_chans,
img_size = img_size,
window_size = window_size,
compress_ratio = compress_ratio,
squeeze_factor = squeeze_factor,
conv_scale = conv_scale,
overlap_ratio = overlap_ratio,
img_range = img_range,
depths = depths,
embed_dim = embed_dim,
num_heads = num_heads,
mlp_ratio = mlp_ratio,
upsampler = upsampler,
resi_connection = resi_connection,
)
self.model.load_state_dict(torch.load(weight_path)['params_ema'])
# cast to device
if device:
self.model.to(torch.device(device))
self.device = device
else:
self.device = self.model.device
self.no_grad() if not grad else None
self.verbose = verbose
def set_device(self, device):
self.model.to(torch.device(device))
self.device = device
def no_grad(self):
self.model.eval()
for param in self.model.parameters():
param.requires_grad = False
def crop_image(self, image, size):
return ImageOps.fit(image, size, Image.LANCZOS)
def resize_image(self, image, size):
# Get the size of the current image
old_size = image.size
# Calculate the ratio of the new size and the old size
ratio = min(float(size[i]) / float(old_size[i]) for i in range(len(size)))
# Calculate the new size
new_size = tuple([int(i*ratio) for i in old_size])
# Resize the image
image = image.resize(new_size, Image.LANCZOS)
# Create a new image with the specified size and fill it with white color
new_image = Image.new("RGB", size, "white")
# Calculate the position to paste the resized image
position = ((size[0] - new_size[0]) // 2, (size[1] - new_size[1]) // 2)
# Paste the resized image to the new image
new_image.paste(image, position)
return new_image
def upsample(self, image_paths: List[str]):
outputs = []
for image_path in tqdm(image_paths):
# load image
img = Image.open(image_path)
img_shape = np.array(img).shape
# crop image to size w/ factor of 16
input_size = img_shape[0] - (img_shape[0] % 16)
cropped_img = self.crop_image(img, (input_size, input_size))
display(cropped_img) if self.verbose else None
# prep image dimension order
input_img = torch.tensor(np.array(cropped_img)).to(self.device).permute(2, 0, 1)
# feed to model
output_tensor = self.model.forward(input_img)
# post process to maintain aspect ratio, ensuring labels are still accurate
output_array = output_tensor.squeeze(0).permute(1, 2, 0).cpu().numpy()
output_img = Image.fromarray((output_array).astype(np.uint8)).convert('RGB')
scaled_output_size = (img_shape[1]*self.model.upscale, img_shape[0]*self.model.upscale)
img = self.resize_image(output_img, scaled_output_size)
outputs += [np.array(img)]
return outputs
hat_model = Hat(models_dir / "HAT" / "HAT_SRx4_ImageNet-pretrain.pth", device="mps")
hat_upsampled = hat_model.upsample([example_image_path])
Image.fromarray(hat_upsampled[0])
0%| | 0/1 [00:00<?, ?it/s]

This may not have been the best instance of the HAT model. During development, we found that expected input sizes were quite small and needed to be squares, meaning inputs would need some preprocessing. The cropping of inputs and resizing of outputs might have attributed to the subjectively poor super-resolution performance of the HAT model on our example image. By this, we are referring to the lime-green artifacts that appears in the output image, which are not present in the input image.
We will need to look into calibrating this model further. One option here can be using a different instance of the model, which would require a new set of config parameters. As such research may be quite time-consumig, we will keep the current implementation, and use it as a starting point for future research.
Single SR image to Benthic Object Detector
ABPN
example_detections = benthic_model._model(example_image)
abpn_detections = benthic_model._model(abpn_upsampled)
example_detections.show()
abpn_detections.show()

ESRGAN
example_detections = benthic_model._model(example_image)
esrgan_detections = benthic_model._model(esrgan_upsampled)
example_detections.show()
esrgan_detections.show()

Here we really see what we are trying to acheive with this super-resolution layer. Look at the 3 new labels, one with quite high confidence, that now have been found by the benthic model.
HAT
example_detections = benthic_model._model(example_image)
hat_detections = benthic_model._model(hat_upsampled)
example_detections.show()
hat_detections.show()
So far, it looks like our ESRGAN model is the best performing model. This was one of our beefier models, so it is expected that it would perform better than the light-weight ABPN model. It is suprising to see that the HAT model performs so poorly on our randomly chosen example. As mentioned before, we'll keep it as is for now, and look into it further in future research.
Build prediction pipeline
abpn_model_path
PosixPath('/Users/per.morten.halvorsen@schibsted.com/personal/models/sr_mobile_python/models_modelx4.ort')
benthic_model_weights_path
PosixPath('/Users/per.morten.halvorsen@schibsted.com/personal/models/fathomnet_benthic/mbari-mb-benthic-33k.pt')
class YOLOv5ModelWithUpsample(YOLOv5Model, torch.nn.Module):
def __init__(
self,
detection_model_path: str = benthic_model_weights_path,
upsample_model: Union[ABPN, ESRGAN, Hat, None] = None
):
super().__init__(detection_model_path)
self.upsample_model = upsample_model
def forward(self, X: List[str]):
if self.upsample_model:
X = self.upsample_model.upsample(X)
return self._model(X)
abpn_pipeline = YOLOv5ModelWithUpsample(benthic_model_weights_path, abpn_model)
abpn_detections = abpn_pipeline.forward([str(example_image_path)]) # upsample expects a list of image paths
abpn_detections.show()
Using cache found in /Users/per.morten.halvorsen@schibsted.com/.cache/torch/hub/ultralytics_yolov5_master YOLOv5 🚀 2024-3-16 Python-3.11.5 torch-2.2.1 CPU Fusing layers... Model summary: 476 layers, 91841704 parameters, 0 gradients Adding AutoShape...
0%| | 0/1 [00:00<?, ?it/s]
esrgan_pipeline = YOLOv5ModelWithUpsample(benthic_model_weights_path, esrgan_model)
esrgan_detections = esrgan_pipeline.forward([str(example_image_path)]) # upsample expects a list of image paths
esrgan_detections.show()
Using cache found in /Users/per.morten.halvorsen@schibsted.com/.cache/torch/hub/ultralytics_yolov5_master YOLOv5 🚀 2024-3-16 Python-3.11.5 torch-2.2.1 CPU Fusing layers... Model summary: 476 layers, 91841704 parameters, 0 gradients Adding AutoShape...
0%| | 0/1 [00:00<?, ?it/s]
hat_pipeline = YOLOv5ModelWithUpsample(benthic_model_weights_path, hat_model)
hat_detections = hat_pipeline.forward([str(example_image_path)]) # upsample expects a list of image paths
hat_detections.show()
Using cache found in /Users/per.morten.halvorsen@schibsted.com/.cache/torch/hub/ultralytics_yolov5_master YOLOv5 🚀 2024-3-16 Python-3.11.5 torch-2.2.1 CPU Fusing layers... Model summary: 476 layers, 91841704 parameters, 0 gradients Adding AutoShape...
0%| | 0/1 [00:00<?, ?it/s]
Here, we'll nned to add a hacky-fix to make sure our call methods between the two models are the same. This will help standardize our evaluation setup later on.
def forward(self, X: List[str]):
return self._model(X)
benthic_model.forward = forward.__get__(benthic_model)
example_detections = benthic_model.forward([str(example_image_path)])
example_detections.show()
Full category classifications
As a sanity check, let us see if we can produce predictions for a large number of images. Here, we'll use the "Eel" class, since that category seemed to have fewest images, as observed in the previous notebook.
N = 5
raw_starfish_detections = benthic_model.forward(starfish_images[:N])
# raw_starfish_detections.show()
abpn_starfish_detections = abpn_pipeline.forward(starfish_images[:N])
# abpn_starfish_detections.show()
0%| | 0/5 [00:00<?, ?it/s]
esrgan_starfish_detections = esrgan_pipeline.forward(starfish_images[:N])
# esrgan_starfish_detections.show()
0%| | 0/5 [00:00<?, ?it/s]
hat_starfish_detections = hat_pipeline.forward(starfish_images[:N])
# hat_starfish_detections.show()
0%| | 0/5 [00:00<?, ?it/s]
Great! Now we can easily feed the TrashCAN dataset through all of our super-resolution models and then through the MBARI model. Its time to move on to model evaluation.
Evaluation
Our evaluation will contain three main steps:
- Make use of mappings and evaluation method from our previous notebook.
- Evaluate both the
benthic_modeland theupscaler_model. - Compare the results of the two models.
# rebuild somneeded params locally
trashcan_ids = {
row["supercategory"]: id
for id, row in trashcan_data.cats.items()
}
# find trash index
trash_idx = list(benthic_model._model.names.values()).index("trash")
print(benthic_model._model.names[trash_idx])
# find trash labels
trashcan_trash_labels = {
id: name
for name, id in trashcan_ids.items()
if name.startswith("trash")
}
trashcan_trash_labels
trash
{9: 'trash_etc',
10: 'trash_fabric',
11: 'trash_fishing_gear',
12: 'trash_metal',
13: 'trash_paper',
14: 'trash_plastic',
15: 'trash_rubber',
16: 'trash_wood'}
# replace str keys with ints
benthic2trashcan_ids = {
int(key): value
for key, value in benthic2trashcan_ids.items()
}
Run evaluation
To evaluate the models, we reuse of some of the functions from the previous notebook.
Specifically, we will use src.evaluation.evaluate_model.
raw_starfish_metrics = evaluate_model(
category="animal_starfish",
data=trashcan_data,
model=benthic_model,
id_map=benthic2trashcan_ids,
one_idx=trash_idx,
many_idx=trashcan_trash_labels,
exclude_ids=[trashcan_ids["rov"], trashcan_ids["plant"]],
path_prefix=data_dir / "dataset" / "material_version" / "val"
)
raw_starfish_metrics["time"]
Precision: 0.37209301460248806 Recall: 0.07920792039996079 Average IoU: tensor(0.29560)
46.661787033081055
abpn_starfish_metrics = evaluate_model(
category="animal_starfish",
data=trashcan_data,
model=abpn_pipeline,
id_map=benthic2trashcan_ids,
one_idx=trash_idx,
many_idx=trashcan_trash_labels,
exclude_ids=[trashcan_ids["rov"], trashcan_ids["plant"]],
path_prefix=data_dir / "dataset" / "material_version" / "val",
x_scale=4, # TODO define variable
y_scale=4
)
abpn_starfish_metrics["time"]
0%| | 0/46 [00:00<?, ?it/s]
Precision: 0.20312499682617194 Recall: 0.06435643532496814 Average IoU: tensor(0.15016)
52.08669114112854
esrgan_starfish_metrics = evaluate_model(
category="animal_starfish",
data=trashcan_data,
model=esrgan_pipeline,
id_map=benthic2trashcan_ids,
one_idx=trash_idx,
many_idx=trashcan_trash_labels,
exclude_ids=[trashcan_ids["rov"], trashcan_ids["plant"]],
path_prefix=data_dir / "dataset" / "material_version" / "val",
x_scale=4, # TODO define variable
y_scale=4
)
esrgan_starfish_metrics["time"]
0%| | 0/46 [00:00<?, ?it/s]
Precision: 0.2142857117346939 Recall: 0.08910891044995589 Average IoU: tensor(0.17836)
108.11618709564209
hat_starfish_metrics = evaluate_model(
category="animal_starfish",
data=trashcan_data,
model=hat_pipeline,
id_map=benthic2trashcan_ids,
one_idx=trash_idx,
many_idx=trashcan_trash_labels,
exclude_ids=[trashcan_ids["rov"], trashcan_ids["plant"]],
path_prefix=data_dir / "dataset" / "material_version" / "val",
x_scale=4, # TODO define variable
y_scale=4
)
hat_starfish_metrics["time"]
0%| | 0/46 [00:00<?, ?it/s]
Precision: 0.43478259924385654 Recall: 0.099009900499951 Average IoU: tensor(0.34594)
377.19130969047546
Woah! The HAT model was the only model to actually improve the performance of the benthic model for the starfish class. This is only a single category, but is a very interesting insight. During implementation, the outputs from the HAT model seemed quite poor. This is a great example of how the performance of a model can be quite different from what you expect.
Let's check out the other categories to see if we see similar results.
Metrics for all categories
def evaluate(model, category, name="", N=20):
# profiler allows us to check the memory consumption
with profile(activities=[ProfilerActivity.CPU], profile_memory=True) as prof:
print()
metrics = evaluate_model(
category=category,
data=trashcan_data,
model=model,
id_map=benthic2trashcan_ids,
N=N,
one_idx=trash_idx,
many_idx=trashcan_trash_labels,
exclude_ids=[trashcan_ids["rov"], trashcan_ids["plant"]],
path_prefix=data_dir / "dataset" / "material_version" / "val",
x_scale=4, # TODO define variable
y_scale=4
)
print(name.upper(), "Model")
print()
print(prof.key_averages().table(sort_by="self_cpu_memory_usage", row_limit=5))
return metrics
Fish
raw_fish_metrics = evaluate(benthic_model, "animal_fish", "benthic")
abpn_fish_metrics = evaluate(abpn_pipeline, "animal_fish", "abpn")
esrgan_fish_metrics = evaluate(esrgan_pipeline, "animal_fish", "esrgan")
hat_fish_metrics = evaluate(hat_pipeline, "animal_fish", "hat")
STAGE:2024-03-11 23:01:22 30539:143864 ActivityProfilerController.cpp:314] Completed Stage: Warm Up
Precision: 0.0 Recall: 0.0 Average IoU: 0.0 BENTHIC Model
STAGE:2024-03-11 23:01:48 30539:143864 ActivityProfilerController.cpp:320] Completed Stage: Collection STAGE:2024-03-11 23:01:48 30539:143864 ActivityProfilerController.cpp:324] Completed Stage: Post Processing
------------------------------------- ------------ ------------ ------------ ------------ ------------ ------------ ------------ ------------
Name Self CPU % Self CPU CPU total % CPU total CPU time avg CPU Mem Self CPU Mem # of Calls
------------------------------------- ------------ ------------ ------------ ------------ ------------ ------------ ------------ ------------
aten::empty 0.00% 796.000us 0.00% 796.000us 2.449us 8.49 Gb 8.49 Gb 325
aten::cat 0.50% 126.437ms 0.50% 126.636ms 4.367ms 3.20 Gb 3.20 Gb 29
aten::add 0.23% 58.814ms 0.23% 58.841ms 486.289us 1.49 Gb 1.49 Gb 121
aten::sigmoid 0.34% 85.547ms 0.34% 85.547ms 28.516ms 1003.60 Mb 1003.60 Mb 3
aten::max_pool2d_with_indices 1.55% 396.735ms 1.55% 396.735ms 132.245ms 131.84 Mb 131.84 Mb 3
------------------------------------- ------------ ------------ ------------ ------------ ------------ ------------ ------------ ------------
Self CPU time total: 25.514s
STAGE:2024-03-11 23:01:48 30539:143864 ActivityProfilerController.cpp:314] Completed Stage: Warm Up
0%| | 0/20 [00:00<?, ?it/s]
Precision: 0.33333327777778704 Recall: 0.03389830451019823 Average IoU: tensor(0.26626) ABPN Model
STAGE:2024-03-11 23:02:16 30539:143864 ActivityProfilerController.cpp:320] Completed Stage: Collection STAGE:2024-03-11 23:02:16 30539:143864 ActivityProfilerController.cpp:324] Completed Stage: Post Processing
------------------------------------- ------------ ------------ ------------ ------------ ------------ ------------ ------------ ------------
Name Self CPU % Self CPU CPU total % CPU total CPU time avg CPU Mem Self CPU Mem # of Calls
------------------------------------- ------------ ------------ ------------ ------------ ------------ ------------ ------------ ------------
aten::empty 0.00% 741.000us 0.00% 741.000us 2.352us 8.54 Gb 8.54 Gb 315
aten::cat 0.92% 237.498ms 0.92% 237.749ms 10.337ms 3.20 Gb 3.20 Gb 23
aten::add 0.21% 54.901ms 0.21% 54.962ms 495.153us 1.49 Gb 1.49 Gb 111
aten::sigmoid 0.36% 92.160ms 0.36% 92.160ms 30.720ms 1003.60 Mb 1003.60 Mb 3
aten::max_pool2d_with_indices 1.53% 395.412ms 1.53% 395.412ms 131.804ms 131.84 Mb 131.84 Mb 3
------------------------------------- ------------ ------------ ------------ ------------ ------------ ------------ ------------ ------------
Self CPU time total: 25.921s
STAGE:2024-03-11 23:02:17 30539:143864 ActivityProfilerController.cpp:314] Completed Stage: Warm Up
0%| | 0/20 [00:00<?, ?it/s]
Precision: 0.16666665277777895 Recall: 0.03389830451019823 Average IoU: tensor(0.13541) ESRGAN Model
STAGE:2024-03-11 23:03:10 30539:143864 ActivityProfilerController.cpp:320] Completed Stage: Collection STAGE:2024-03-11 23:03:10 30539:143864 ActivityProfilerController.cpp:324] Completed Stage: Post Processing
------------------------------------- ------------ ------------ ------------ ------------ ------------ ------------ ------------ ------------
Name Self CPU % Self CPU CPU total % CPU total CPU time avg CPU Mem Self CPU Mem # of Calls
------------------------------------- ------------ ------------ ------------ ------------ ------------ ------------ ------------ ------------
aten::empty 0.05% 24.961ms 0.05% 24.961ms 3.362us 8.34 Gb 8.34 Gb 7424
aten::cat 13.67% 7.148s 13.67% 7.148s 1.287ms 3.20 Gb 3.20 Gb 5554
aten::add 1.45% 759.308ms 1.45% 759.372ms 374.999us 1.49 Gb 1.49 Gb 2025
aten::sigmoid 0.19% 98.839ms 0.19% 98.839ms 32.946ms 1003.60 Mb 1003.60 Mb 3
aten::empty_strided 0.00% 777.000us 0.00% 777.000us 1.165us 544.93 Mb 544.93 Mb 667
------------------------------------- ------------ ------------ ------------ ------------ ------------ ------------ ------------ ------------
Self CPU time total: 52.282s
STAGE:2024-03-11 23:03:14 30539:143864 ActivityProfilerController.cpp:314] Completed Stage: Warm Up
0%| | 0/20 [00:00<?, ?it/s]
Precision: 0.49999991666668053 Recall: 0.050847456765297346 Average IoU: tensor(0.38517) HAT Model
STAGE:2024-03-11 23:05:46 30539:143864 ActivityProfilerController.cpp:320] Completed Stage: Collection STAGE:2024-03-11 23:05:46 30539:143864 ActivityProfilerController.cpp:324] Completed Stage: Post Processing
------------------------------------- ------------ ------------ ------------ ------------ ------------ ------------ ------------ ------------
Name Self CPU % Self CPU CPU total % CPU total CPU time avg CPU Mem Self CPU Mem # of Calls
------------------------------------- ------------ ------------ ------------ ------------ ------------ ------------ ------------ ------------
aten::empty 0.02% 31.508ms 0.02% 31.508ms 1.050us 24.00 Gb 24.00 Gb 30003
aten::resize_ 3.43% 5.181s 3.43% 5.181s 39.857ms 15.53 Gb 15.53 Gb 130
aten::empty_strided 0.00% 4.210ms 0.00% 4.210ms 5.249us 11.99 Gb 11.99 Gb 802
aten::cat 3.67% 5.544s 3.67% 5.546s 3.493ms 3.20 Gb 3.20 Gb 1588
aten::add 3.52% 5.316s 3.53% 5.334s 1.373ms 1.49 Gb 1.49 Gb 3884
------------------------------------- ------------ ------------ ------------ ------------ ------------ ------------ ------------ ------------
Self CPU time total: 151.136s
Crab
raw_crab_metrics = evaluate(benthic_model, "animal_crab", "benthic")
abpn_crab_metrics = evaluate(abpn_pipeline, "animal_crab", "abpn")
esrgan_crab_metrics = evaluate(esrgan_pipeline, "animal_crab", "esrgan")
hat_crab_metrics = evaluate(hat_pipeline, "animal_crab", "hat")
STAGE:2024-03-11 23:05:55 30539:143864 ActivityProfilerController.cpp:314] Completed Stage: Warm Up
Precision: 0.0 Recall: 0.0 Average IoU: 0.0 BENTHIC Model
STAGE:2024-03-11 23:06:21 30539:143864 ActivityProfilerController.cpp:320] Completed Stage: Collection STAGE:2024-03-11 23:06:21 30539:143864 ActivityProfilerController.cpp:324] Completed Stage: Post Processing
------------------------------------- ------------ ------------ ------------ ------------ ------------ ------------ ------------ ------------
Name Self CPU % Self CPU CPU total % CPU total CPU time avg CPU Mem Self CPU Mem # of Calls
------------------------------------- ------------ ------------ ------------ ------------ ------------ ------------ ------------ ------------
aten::empty 0.00% 707.000us 0.00% 707.000us 1.704us 8.54 Gb 8.54 Gb 415
aten::cat 2.78% 710.329ms 2.78% 710.547ms 20.898ms 3.20 Gb 3.20 Gb 34
aten::add 0.20% 51.887ms 0.20% 52.080ms 186.000us 1.49 Gb 1.49 Gb 280
aten::sigmoid 0.41% 105.032ms 0.41% 105.032ms 35.011ms 1003.60 Mb 1003.60 Mb 3
aten::max_pool2d_with_indices 1.50% 384.054ms 1.50% 384.054ms 128.018ms 131.84 Mb 131.84 Mb 3
------------------------------------- ------------ ------------ ------------ ------------ ------------ ------------ ------------ ------------
Self CPU time total: 25.533s
STAGE:2024-03-11 23:06:23 30539:143864 ActivityProfilerController.cpp:314] Completed Stage: Warm Up
0%| | 0/20 [00:00<?, ?it/s]
Precision: 0.013333333155555559 Recall: 0.01149425274144537 Average IoU: tensor(0.01037) ABPN Model
STAGE:2024-03-11 23:06:50 30539:143864 ActivityProfilerController.cpp:320] Completed Stage: Collection STAGE:2024-03-11 23:06:50 30539:143864 ActivityProfilerController.cpp:324] Completed Stage: Post Processing
------------------------------------- ------------ ------------ ------------ ------------ ------------ ------------ ------------ ------------
Name Self CPU % Self CPU CPU total % CPU total CPU time avg CPU Mem Self CPU Mem # of Calls
------------------------------------- ------------ ------------ ------------ ------------ ------------ ------------ ------------ ------------
aten::empty 0.00% 725.000us 0.00% 725.000us 1.959us 8.54 Gb 8.54 Gb 370
aten::cat 1.26% 324.732ms 1.26% 324.930ms 11.204ms 3.20 Gb 3.20 Gb 29
aten::add 0.22% 56.119ms 0.22% 56.607ms 112.093us 1.49 Gb 1.49 Gb 505
aten::sigmoid 0.44% 113.767ms 0.44% 113.767ms 37.922ms 1003.60 Mb 1003.60 Mb 3
aten::max_pool2d_with_indices 1.49% 382.600ms 1.49% 382.600ms 127.533ms 131.84 Mb 131.84 Mb 3
------------------------------------- ------------ ------------ ------------ ------------ ------------ ------------ ------------ ------------
Self CPU time total: 25.694s
STAGE:2024-03-11 23:06:53 30539:143864 ActivityProfilerController.cpp:314] Completed Stage: Warm Up
0%| | 0/20 [00:00<?, ?it/s]
Precision: 0.008695652098298678 Recall: 0.01149425274144537 Average IoU: tensor(0.00913) ESRGAN Model
STAGE:2024-03-11 23:07:49 30539:143864 ActivityProfilerController.cpp:320] Completed Stage: Collection STAGE:2024-03-11 23:07:49 30539:143864 ActivityProfilerController.cpp:324] Completed Stage: Post Processing
------------------------------------- ------------ ------------ ------------ ------------ ------------ ------------ ------------ ------------
Name Self CPU % Self CPU CPU total % CPU total CPU time avg CPU Mem Self CPU Mem # of Calls
------------------------------------- ------------ ------------ ------------ ------------ ------------ ------------ ------------ ------------
aten::empty 0.05% 29.082ms 0.05% 29.082ms 3.925us 8.54 Gb 8.54 Gb 7410
aten::cat 17.21% 9.378s 17.21% 9.378s 1.690ms 3.20 Gb 3.20 Gb 5549
aten::add 2.54% 1.385s 2.54% 1.386s 497.175us 1.49 Gb 1.49 Gb 2787
aten::sigmoid 0.19% 101.354ms 0.19% 101.354ms 33.785ms 1003.60 Mb 1003.60 Mb 3
aten::empty_strided 0.00% 625.000us 0.00% 625.000us 0.080us 576.61 Mb 576.61 Mb 7814
------------------------------------- ------------ ------------ ------------ ------------ ------------ ------------ ------------ ------------
Self CPU time total: 54.499s
STAGE:2024-03-11 23:07:56 30539:143864 ActivityProfilerController.cpp:314] Completed Stage: Warm Up
0%| | 0/20 [00:00<?, ?it/s]
Precision: 0.11111110493827195 Recall: 0.02298850548289074 Average IoU: tensor(0.10181) HAT Model
STAGE:2024-03-11 23:10:44 30539:143864 ActivityProfilerController.cpp:320] Completed Stage: Collection STAGE:2024-03-11 23:10:44 30539:143864 ActivityProfilerController.cpp:324] Completed Stage: Post Processing
------------------------------------- ------------ ------------ ------------ ------------ ------------ ------------ ------------ ------------
Name Self CPU % Self CPU CPU total % CPU total CPU time avg CPU Mem Self CPU Mem # of Calls
------------------------------------- ------------ ------------ ------------ ------------ ------------ ------------ ------------ ------------
aten::empty 0.03% 42.097ms 0.03% 42.097ms 1.401us 26.07 Gb 26.07 Gb 30055
aten::resize_ 3.34% 5.575s 3.34% 5.575s 39.263ms 17.88 Gb 17.88 Gb 142
aten::empty_strided 0.00% 4.375ms 0.00% 4.375ms 2.587us 13.63 Gb 13.63 Gb 1691
aten::cat 3.83% 6.399s 3.84% 6.401s 4.028ms 3.20 Gb 3.20 Gb 1589
aten::sub 0.12% 202.018ms 0.12% 202.514ms 373.642us 1.70 Gb 1.70 Gb 542
------------------------------------- ------------ ------------ ------------ ------------ ------------ ------------ ------------ ------------
Self CPU time total: 166.854s
Eel
raw_eel_metrics = evaluate(benthic_model, "animal_eel", "benthic")
abpn_eel_metrics = evaluate(abpn_pipeline, "animal_eel", "abpn")
esrgan_eel_metrics = evaluate(esrgan_pipeline, "animal_eel", "esrgan")
hat_eel_metrics = evaluate(hat_pipeline, "animal_eel", "hat")
STAGE:2024-03-11 23:29:59 30539:143864 ActivityProfilerController.cpp:314] Completed Stage: Warm Up [W CPUAllocator.cpp:235] Memory block of unknown size was allocated before the profiling started, profiler results will not include the deallocation event
Precision: 0.0 Recall: 0.0 Average IoU: 0.0 BENTHIC Model
STAGE:2024-03-11 23:30:21 30539:143864 ActivityProfilerController.cpp:320] Completed Stage: Collection STAGE:2024-03-11 23:30:21 30539:143864 ActivityProfilerController.cpp:324] Completed Stage: Post Processing
------------------------------------- ------------ ------------ ------------ ------------ ------------ ------------ ------------ ------------
Name Self CPU % Self CPU CPU total % CPU total CPU time avg CPU Mem Self CPU Mem # of Calls
------------------------------------- ------------ ------------ ------------ ------------ ------------ ------------ ------------ ------------
aten::empty 0.00% 752.000us 0.00% 752.000us 2.173us 6.95 Gb 6.95 Gb 346
aten::cat 5.80% 1.248s 5.80% 1.249s 35.675ms 2.56 Gb 2.56 Gb 35
aten::add 0.19% 41.607ms 0.19% 41.632ms 315.394us 1.19 Gb 1.19 Gb 132
aten::sigmoid 0.38% 82.467ms 0.38% 82.467ms 27.489ms 802.88 Mb 802.88 Mb 3
aten::max_pool2d_with_indices 1.36% 293.307ms 1.36% 293.307ms 97.769ms 105.47 Mb 105.47 Mb 3
------------------------------------- ------------ ------------ ------------ ------------ ------------ ------------ ------------ ------------
Self CPU time total: 21.522s
STAGE:2024-03-11 23:30:22 30539:143864 ActivityProfilerController.cpp:314] Completed Stage: Warm Up
0%| | 0/20 [00:00<?, ?it/s]
Precision: 0.0 Recall: 0.0 Average IoU: 0.0 ABPN Model
STAGE:2024-03-11 23:30:45 30539:143864 ActivityProfilerController.cpp:320] Completed Stage: Collection STAGE:2024-03-11 23:30:45 30539:143864 ActivityProfilerController.cpp:324] Completed Stage: Post Processing
------------------------------------- ------------ ------------ ------------ ------------ ------------ ------------ ------------ ------------
Name Self CPU % Self CPU CPU total % CPU total CPU time avg CPU Mem Self CPU Mem # of Calls
------------------------------------- ------------ ------------ ------------ ------------ ------------ ------------ ------------ ------------
aten::empty 0.00% 792.000us 0.00% 792.000us 2.336us 6.95 Gb 6.95 Gb 339
aten::cat 1.11% 237.958ms 1.11% 238.214ms 8.214ms 2.56 Gb 2.56 Gb 29
aten::add 0.19% 40.676ms 0.19% 40.703ms 357.044us 1.19 Gb 1.19 Gb 114
aten::sigmoid 0.49% 105.003ms 0.49% 105.003ms 35.001ms 802.88 Mb 802.88 Mb 3
aten::empty_like 0.00% 33.000us 0.00% 104.000us 2.419us 978.66 Mb 152.93 Mb 43
------------------------------------- ------------ ------------ ------------ ------------ ------------ ------------ ------------ ------------
Self CPU time total: 21.427s
STAGE:2024-03-11 23:30:46 30539:143864 ActivityProfilerController.cpp:314] Completed Stage: Warm Up
0%| | 0/20 [00:00<?, ?it/s]
Precision: 0.2857142653061239 Recall: 0.08333333159722227 Average IoU: tensor(0.21974) ESRGAN Model
STAGE:2024-03-11 23:31:33 30539:143864 ActivityProfilerController.cpp:320] Completed Stage: Collection STAGE:2024-03-11 23:31:33 30539:143864 ActivityProfilerController.cpp:324] Completed Stage: Post Processing
------------------------------------- ------------ ------------ ------------ ------------ ------------ ------------ ------------ ------------
Name Self CPU % Self CPU CPU total % CPU total CPU time avg CPU Mem Self CPU Mem # of Calls
------------------------------------- ------------ ------------ ------------ ------------ ------------ ------------ ------------ ------------
aten::empty 0.05% 23.116ms 0.05% 23.116ms 3.120us 6.95 Gb 6.95 Gb 7408
aten::cat 13.39% 6.148s 13.39% 6.148s 1.107ms 2.56 Gb 2.56 Gb 5555
aten::add 0.38% 175.796ms 0.38% 175.854ms 87.316us 1.19 Gb 1.19 Gb 2014
aten::sigmoid 0.21% 94.995ms 0.21% 94.995ms 31.665ms 802.88 Mb 802.88 Mb 3
aten::empty_strided 0.00% 674.000us 0.00% 674.000us 1.127us 530.86 Mb 530.86 Mb 598
------------------------------------- ------------ ------------ ------------ ------------ ------------ ------------ ------------ ------------
Self CPU time total: 45.908s
STAGE:2024-03-11 23:31:36 30539:143864 ActivityProfilerController.cpp:314] Completed Stage: Warm Up
0%| | 0/20 [00:00<?, ?it/s]
Precision: 0.3636363305785154 Recall: 0.08333333159722227 Average IoU: tensor(0.27386) HAT Model
STAGE:2024-03-11 23:33:31 30539:143864 ActivityProfilerController.cpp:320] Completed Stage: Collection STAGE:2024-03-11 23:33:31 30539:143864 ActivityProfilerController.cpp:324] Completed Stage: Post Processing
------------------------------------- ------------ ------------ ------------ ------------ ------------ ------------ ------------ ------------
Name Self CPU % Self CPU CPU total % CPU total CPU time avg CPU Mem Self CPU Mem # of Calls
------------------------------------- ------------ ------------ ------------ ------------ ------------ ------------ ------------ ------------
aten::empty 0.02% 27.413ms 0.02% 27.413ms 0.913us 20.02 Gb 20.02 Gb 30034
aten::resize_ 2.87% 3.277s 2.87% 3.277s 23.080ms 13.18 Gb 13.18 Gb 142
aten::empty_strided 0.00% 4.253ms 0.00% 4.253ms 4.911us 10.35 Gb 10.35 Gb 866
aten::cat 1.06% 1.208s 1.06% 1.209s 758.708us 2.56 Gb 2.56 Gb 1594
aten::sub 0.07% 77.775ms 0.07% 78.057ms 369.938us 1.25 Gb 1.25 Gb 211
------------------------------------- ------------ ------------ ------------ ------------ ------------ ------------ ------------ ------------
Self CPU time total: 114.019s
Shells
raw_shell_metrics = evaluate(benthic_model, "animal_shell", "benthic")
abpn_shell_metrics = evaluate(abpn_pipeline, "animal_shell", "abpn")
esrgan_shell_metrics = evaluate(esrgan_pipeline, "animal_shell", "esrgan")
hat_shell_metrics = evaluate(hat_pipeline, "animal_shell", "hat")
STAGE:2024-03-11 23:10:55 30539:143864 ActivityProfilerController.cpp:314] Completed Stage: Warm Up
Precision: 0.0 Recall: 0.0 Average IoU: 0.0 BENTHIC Model
STAGE:2024-03-11 23:11:21 30539:143864 ActivityProfilerController.cpp:320] Completed Stage: Collection STAGE:2024-03-11 23:11:21 30539:143864 ActivityProfilerController.cpp:324] Completed Stage: Post Processing STAGE:2024-03-11 23:11:21 30539:143864 ActivityProfilerController.cpp:314] Completed Stage: Warm Up
------------------------------------- ------------ ------------ ------------ ------------ ------------ ------------ ------------ ------------
Name Self CPU % Self CPU CPU total % CPU total CPU time avg CPU Mem Self CPU Mem # of Calls
------------------------------------- ------------ ------------ ------------ ------------ ------------ ------------ ------------ ------------
aten::empty 0.00% 722.000us 0.00% 722.000us 2.337us 8.35 Gb 8.35 Gb 309
aten::cat 3.30% 843.995ms 3.30% 844.226ms 31.268ms 3.20 Gb 3.20 Gb 27
aten::add 0.20% 51.719ms 0.20% 51.725ms 533.247us 1.49 Gb 1.49 Gb 97
aten::sigmoid 0.39% 99.917ms 0.39% 99.917ms 33.306ms 1003.60 Mb 1003.60 Mb 3
aten::empty_like 0.00% 26.000us 0.00% 60.000us 2.069us 1.05 Gb 238.95 Mb 29
------------------------------------- ------------ ------------ ------------ ------------ ------------ ------------ ------------ ------------
Self CPU time total: 25.552s
0%| | 0/20 [00:00<?, ?it/s]
Precision: 0.0 Recall: 0.0 Average IoU: 0.0 ABPN Model
STAGE:2024-03-11 23:11:49 30539:143864 ActivityProfilerController.cpp:320] Completed Stage: Collection STAGE:2024-03-11 23:11:49 30539:143864 ActivityProfilerController.cpp:324] Completed Stage: Post Processing
------------------------------------- ------------ ------------ ------------ ------------ ------------ ------------ ------------ ------------
Name Self CPU % Self CPU CPU total % CPU total CPU time avg CPU Mem Self CPU Mem # of Calls
------------------------------------- ------------ ------------ ------------ ------------ ------------ ------------ ------------ ------------
aten::empty 0.00% 717.000us 0.00% 717.000us 2.328us 8.54 Gb 8.54 Gb 308
aten::cat 1.04% 270.200ms 1.04% 270.423ms 10.401ms 3.20 Gb 3.20 Gb 26
aten::add 0.21% 55.376ms 0.21% 55.462ms 338.183us 1.49 Gb 1.49 Gb 164
aten::sigmoid 0.45% 117.408ms 0.45% 117.408ms 39.136ms 1003.60 Mb 1003.60 Mb 3
aten::max_pool2d_with_indices 1.48% 385.957ms 1.48% 385.957ms 128.652ms 131.84 Mb 131.84 Mb 3
------------------------------------- ------------ ------------ ------------ ------------ ------------ ------------ ------------ ------------
Self CPU time total: 26.001s
STAGE:2024-03-11 23:11:49 30539:143864 ActivityProfilerController.cpp:314] Completed Stage: Warm Up
0%| | 0/20 [00:00<?, ?it/s]
Precision: 0.0 Recall: 0.0 Average IoU: 0.0 ESRGAN Model
STAGE:2024-03-11 23:12:43 30539:143864 ActivityProfilerController.cpp:320] Completed Stage: Collection STAGE:2024-03-11 23:12:43 30539:143864 ActivityProfilerController.cpp:324] Completed Stage: Post Processing
------------------------------------- ------------ ------------ ------------ ------------ ------------ ------------ ------------ ------------
Name Self CPU % Self CPU CPU total % CPU total CPU time avg CPU Mem Self CPU Mem # of Calls
------------------------------------- ------------ ------------ ------------ ------------ ------------ ------------ ------------ ------------
aten::empty 0.06% 30.364ms 0.06% 30.364ms 4.127us 8.54 Gb 8.54 Gb 7357
aten::cat 13.63% 7.187s 13.63% 7.187s 1.296ms 3.20 Gb 3.20 Gb 5546
aten::add 1.23% 648.459ms 1.23% 648.471ms 330.515us 1.49 Gb 1.49 Gb 1962
aten::sigmoid 0.20% 105.889ms 0.20% 105.889ms 35.296ms 1003.60 Mb 1003.60 Mb 3
aten::empty_strided 0.00% 651.000us 0.00% 651.000us 1.674us 544.92 Mb 544.92 Mb 389
------------------------------------- ------------ ------------ ------------ ------------ ------------ ------------ ------------ ------------
Self CPU time total: 52.715s
STAGE:2024-03-11 23:12:47 30539:143864 ActivityProfilerController.cpp:314] Completed Stage: Warm Up
0%| | 0/20 [00:00<?, ?it/s]
Precision: 0.0 Recall: 0.0 Average IoU: 0.0 HAT Model
STAGE:2024-03-11 23:15:18 30539:143864 ActivityProfilerController.cpp:320] Completed Stage: Collection STAGE:2024-03-11 23:15:18 30539:143864 ActivityProfilerController.cpp:324] Completed Stage: Post Processing
------------------------------------- ------------ ------------ ------------ ------------ ------------ ------------ ------------ ------------
Name Self CPU % Self CPU CPU total % CPU total CPU time avg CPU Mem Self CPU Mem # of Calls
------------------------------------- ------------ ------------ ------------ ------------ ------------ ------------ ------------ ------------
aten::empty 0.02% 29.626ms 0.02% 29.626ms 0.989us 23.55 Gb 23.55 Gb 29953
aten::resize_ 3.61% 5.430s 3.61% 5.430s 44.506ms 14.94 Gb 14.94 Gb 122
aten::empty_strided 0.00% 4.174ms 0.00% 4.174ms 7.414us 11.42 Gb 11.42 Gb 563
aten::cat 3.47% 5.208s 3.47% 5.210s 3.295ms 3.20 Gb 3.20 Gb 1581
aten::add 3.42% 5.140s 3.43% 5.157s 1.343ms 1.49 Gb 1.49 Gb 3839
------------------------------------- ------------ ------------ ------------ ------------ ------------ ------------ ------------ ------------
Self CPU time total: 150.234s
Trash
raw_trash_metrics = evaluate(benthic_model, "trash_plastic", "benthic")
abpn_trash_metrics = evaluate(abpn_pipeline, "trash_plastic", "abpn")
esrgan_trash_metrics = evaluate(esrgan_pipeline, "trash_plastic", "esrgan")
hat_trash_metrics = evaluate(hat_pipeline, "trash_plastic", "hat")
STAGE:2024-03-11 23:15:27 30539:143864 ActivityProfilerController.cpp:314] Completed Stage: Warm Up
Precision: 0.0 Recall: 0.0 Average IoU: 0.0 BENTHIC Model
STAGE:2024-03-11 23:15:53 30539:143864 ActivityProfilerController.cpp:320] Completed Stage: Collection STAGE:2024-03-11 23:15:53 30539:143864 ActivityProfilerController.cpp:324] Completed Stage: Post Processing
------------------------------------- ------------ ------------ ------------ ------------ ------------ ------------ ------------ ------------
Name Self CPU % Self CPU CPU total % CPU total CPU time avg CPU Mem Self CPU Mem # of Calls
------------------------------------- ------------ ------------ ------------ ------------ ------------ ------------ ------------ ------------
aten::empty 0.00% 672.000us 0.00% 672.000us 2.161us 8.54 Gb 8.54 Gb 311
aten::cat 1.70% 432.191ms 1.70% 432.402ms 18.017ms 3.20 Gb 3.20 Gb 24
aten::add 0.20% 50.950ms 0.20% 50.975ms 485.476us 1.49 Gb 1.49 Gb 105
aten::sigmoid 0.39% 99.362ms 0.39% 99.362ms 33.121ms 1003.60 Mb 1003.60 Mb 3
aten::empty_like 0.00% 54.000us 0.00% 69.000us 2.556us 1.05 Gb 764.65 Mb 27
------------------------------------- ------------ ------------ ------------ ------------ ------------ ------------ ------------ ------------
Self CPU time total: 25.423s
STAGE:2024-03-11 23:15:53 30539:143864 ActivityProfilerController.cpp:314] Completed Stage: Warm Up
0%| | 0/20 [00:00<?, ?it/s]
Precision: 0.035714284438775556 Recall: 0.014084506843880186 Average IoU: tensor(0.02660) ABPN Model
STAGE:2024-03-11 23:16:22 30539:143864 ActivityProfilerController.cpp:320] Completed Stage: Collection STAGE:2024-03-11 23:16:22 30539:143864 ActivityProfilerController.cpp:324] Completed Stage: Post Processing
------------------------------------- ------------ ------------ ------------ ------------ ------------ ------------ ------------ ------------
Name Self CPU % Self CPU CPU total % CPU total CPU time avg CPU Mem Self CPU Mem # of Calls
------------------------------------- ------------ ------------ ------------ ------------ ------------ ------------ ------------ ------------
aten::empty 0.00% 765.000us 0.00% 765.000us 2.243us 8.51 Gb 8.51 Gb 341
aten::cat 1.22% 320.818ms 1.22% 321.030ms 11.890ms 3.20 Gb 3.20 Gb 27
aten::add 0.20% 53.035ms 0.20% 53.274ms 189.587us 1.49 Gb 1.49 Gb 281
aten::sigmoid 0.38% 99.780ms 0.38% 99.780ms 33.260ms 1003.60 Mb 1003.60 Mb 3
aten::empty_like 0.00% 58.000us 0.00% 73.000us 1.780us 1.00 Gb 955.81 Mb 41
------------------------------------- ------------ ------------ ------------ ------------ ------------ ------------ ------------ ------------
Self CPU time total: 26.403s
STAGE:2024-03-11 23:16:24 30539:143864 ActivityProfilerController.cpp:314] Completed Stage: Warm Up
0%| | 0/20 [00:00<?, ?it/s]
Precision: 0.24999993750001562 Recall: 0.014084506843880186 Average IoU: tensor(0.18600) ESRGAN Model
STAGE:2024-03-11 23:17:19 30539:143864 ActivityProfilerController.cpp:320] Completed Stage: Collection STAGE:2024-03-11 23:17:19 30539:143864 ActivityProfilerController.cpp:324] Completed Stage: Post Processing
------------------------------------- ------------ ------------ ------------ ------------ ------------ ------------ ------------ ------------
Name Self CPU % Self CPU CPU total % CPU total CPU time avg CPU Mem Self CPU Mem # of Calls
------------------------------------- ------------ ------------ ------------ ------------ ------------ ------------ ------------ ------------
aten::empty 0.06% 30.510ms 0.06% 30.510ms 4.156us 8.53 Gb 8.53 Gb 7341
aten::cat 14.51% 7.936s 14.51% 7.936s 1.432ms 3.20 Gb 3.20 Gb 5543
aten::add 1.96% 1.072s 1.96% 1.072s 547.347us 1.49 Gb 1.49 Gb 1959
aten::sigmoid 0.16% 87.453ms 0.16% 87.453ms 29.151ms 1003.60 Mb 1003.60 Mb 3
aten::empty_strided 0.00% 737.000us 0.00% 737.000us 2.200us 473.73 Mb 473.73 Mb 335
------------------------------------- ------------ ------------ ------------ ------------ ------------ ------------ ------------ ------------
Self CPU time total: 54.684s
STAGE:2024-03-11 23:17:23 30539:143864 ActivityProfilerController.cpp:314] Completed Stage: Warm Up
0%| | 0/20 [00:00<?, ?it/s]
Precision: 0.285714244897965 Recall: 0.028169013687760373 Average IoU: tensor(0.20661) HAT Model
STAGE:2024-03-11 23:19:55 30539:143864 ActivityProfilerController.cpp:320] Completed Stage: Collection STAGE:2024-03-11 23:19:55 30539:143864 ActivityProfilerController.cpp:324] Completed Stage: Post Processing
------------------------------------- ------------ ------------ ------------ ------------ ------------ ------------ ------------ ------------
Name Self CPU % Self CPU CPU total % CPU total CPU time avg CPU Mem Self CPU Mem # of Calls
------------------------------------- ------------ ------------ ------------ ------------ ------------ ------------ ------------ ------------
aten::empty 0.02% 36.968ms 0.02% 36.968ms 1.232us 25.19 Gb 25.19 Gb 29995
aten::resize_ 3.50% 5.330s 3.50% 5.330s 41.002ms 16.71 Gb 16.71 Gb 130
aten::empty_strided 0.00% 4.261ms 0.00% 4.261ms 4.688us 12.21 Gb 12.21 Gb 909
aten::cat 3.97% 6.033s 3.97% 6.035s 3.810ms 3.20 Gb 3.20 Gb 1584
aten::sub 0.05% 70.755ms 0.05% 71.011ms 298.366us 1.58 Gb 1.58 Gb 238
------------------------------------- ------------ ------------ ------------ ------------ ------------ ------------ ------------ ------------
Self CPU time total: 152.132s
Metal
raw_metal_metrics = evaluate(benthic_model, "trash_metal", "benthic")
abpn_metal_metrics = evaluate(abpn_pipeline, "trash_metal", "abpn")
esrgan_metal_metrics = evaluate(esrgan_pipeline, "trash_metal", "esrgan")
hat_metal_metrics = evaluate(hat_pipeline, "trash_metal", "hat")
STAGE:2024-03-11 23:20:05 30539:143864 ActivityProfilerController.cpp:314] Completed Stage: Warm Up
Precision: 0.0 Recall: 0.0 Average IoU: 0.0 BENTHIC Model
STAGE:2024-03-11 23:20:31 30539:143864 ActivityProfilerController.cpp:320] Completed Stage: Collection STAGE:2024-03-11 23:20:31 30539:143864 ActivityProfilerController.cpp:324] Completed Stage: Post Processing
------------------------------------- ------------ ------------ ------------ ------------ ------------ ------------ ------------ ------------
Name Self CPU % Self CPU CPU total % CPU total CPU time avg CPU Mem Self CPU Mem # of Calls
------------------------------------- ------------ ------------ ------------ ------------ ------------ ------------ ------------ ------------
aten::empty 0.00% 671.000us 0.00% 671.000us 1.997us 8.54 Gb 8.54 Gb 336
aten::cat 3.65% 950.446ms 3.65% 950.676ms 35.210ms 3.20 Gb 3.20 Gb 27
aten::add 0.20% 51.024ms 0.20% 51.102ms 313.509us 1.49 Gb 1.49 Gb 163
aten::sigmoid 0.38% 97.993ms 0.38% 97.993ms 32.664ms 1003.60 Mb 1003.60 Mb 3
aten::max_pool2d_with_indices 1.48% 386.081ms 1.48% 386.081ms 128.694ms 131.84 Mb 131.84 Mb 3
------------------------------------- ------------ ------------ ------------ ------------ ------------ ------------ ------------ ------------
Self CPU time total: 26.074s
STAGE:2024-03-11 23:20:32 30539:143864 ActivityProfilerController.cpp:314] Completed Stage: Warm Up
0%| | 0/20 [00:00<?, ?it/s]
Precision: 0.0 Recall: 0.0 Average IoU: 0.0 ABPN Model
STAGE:2024-03-11 23:20:59 30539:143864 ActivityProfilerController.cpp:320] Completed Stage: Collection STAGE:2024-03-11 23:20:59 30539:143864 ActivityProfilerController.cpp:324] Completed Stage: Post Processing
------------------------------------- ------------ ------------ ------------ ------------ ------------ ------------ ------------ ------------
Name Self CPU % Self CPU CPU total % CPU total CPU time avg CPU Mem Self CPU Mem # of Calls
------------------------------------- ------------ ------------ ------------ ------------ ------------ ------------ ------------ ------------
aten::empty 0.00% 734.000us 0.00% 734.000us 2.128us 8.54 Gb 8.54 Gb 345
aten::cat 0.78% 200.175ms 0.78% 200.389ms 7.422ms 3.20 Gb 3.20 Gb 27
aten::add 0.22% 55.845ms 0.22% 56.055ms 219.824us 1.49 Gb 1.49 Gb 255
aten::sigmoid 0.45% 116.273ms 0.45% 116.273ms 38.758ms 1003.60 Mb 1003.60 Mb 3
aten::max_pool2d_with_indices 1.50% 385.711ms 1.50% 385.711ms 128.570ms 131.84 Mb 131.84 Mb 3
------------------------------------- ------------ ------------ ------------ ------------ ------------ ------------ ------------ ------------
Self CPU time total: 25.660s
STAGE:2024-03-11 23:21:01 30539:143864 ActivityProfilerController.cpp:314] Completed Stage: Warm Up
0%| | 0/20 [00:00<?, ?it/s]
Precision: 0.0 Recall: 0.0 Average IoU: 0.0 ESRGAN Model
STAGE:2024-03-11 23:21:55 30539:143864 ActivityProfilerController.cpp:320] Completed Stage: Collection STAGE:2024-03-11 23:21:55 30539:143864 ActivityProfilerController.cpp:324] Completed Stage: Post Processing
------------------------------------- ------------ ------------ ------------ ------------ ------------ ------------ ------------ ------------
Name Self CPU % Self CPU CPU total % CPU total CPU time avg CPU Mem Self CPU Mem # of Calls
------------------------------------- ------------ ------------ ------------ ------------ ------------ ------------ ------------ ------------
aten::empty 0.06% 29.801ms 0.06% 29.801ms 4.067us 8.35 Gb 8.35 Gb 7327
aten::cat 14.34% 7.590s 14.34% 7.590s 1.369ms 3.20 Gb 3.20 Gb 5543
aten::add 1.24% 656.848ms 1.24% 656.954ms 324.422us 1.49 Gb 1.49 Gb 2025
aten::sigmoid 0.18% 94.047ms 0.18% 94.047ms 31.349ms 1003.60 Mb 1003.60 Mb 3
aten::empty_strided 0.00% 658.000us 0.00% 658.000us 0.532us 505.38 Mb 505.38 Mb 1238
------------------------------------- ------------ ------------ ------------ ------------ ------------ ------------ ------------ ------------
Self CPU time total: 52.927s
STAGE:2024-03-11 23:21:59 30539:143864 ActivityProfilerController.cpp:314] Completed Stage: Warm Up
0%| | 0/20 [00:00<?, ?it/s]
Precision: 0.199999960000008 Recall: 0.01612903199791884 Average IoU: tensor(0.16952) HAT Model
STAGE:2024-03-11 23:24:22 30539:143864 ActivityProfilerController.cpp:320] Completed Stage: Collection STAGE:2024-03-11 23:24:22 30539:143864 ActivityProfilerController.cpp:324] Completed Stage: Post Processing
------------------------------------- ------------ ------------ ------------ ------------ ------------ ------------ ------------ ------------
Name Self CPU % Self CPU CPU total % CPU total CPU time avg CPU Mem Self CPU Mem # of Calls
------------------------------------- ------------ ------------ ------------ ------------ ------------ ------------ ------------ ------------
aten::empty 0.02% 30.678ms 0.02% 30.678ms 1.023us 23.48 Gb 23.48 Gb 30001
aten::resize_ 3.22% 4.618s 3.22% 4.618s 35.522ms 14.94 Gb 14.94 Gb 130
aten::empty_strided 0.00% 4.067ms 0.00% 4.067ms 5.201us 11.26 Gb 11.26 Gb 782
aten::cat 3.47% 4.972s 3.47% 4.974s 3.138ms 3.20 Gb 3.20 Gb 1585
aten::add 3.73% 5.343s 3.74% 5.360s 1.384ms 1.49 Gb 1.49 Gb 3874
------------------------------------- ------------ ------------ ------------ ------------ ------------ ------------ ------------ ------------
Self CPU time total: 143.194s
Wood
raw_wood_metrics = evaluate(benthic_model, "trash_wood", "benthic")
abpn_wood_metrics = evaluate(abpn_pipeline, "trash_wood", "abpn")
esrgan_wood_metrics = evaluate(esrgan_pipeline, "trash_wood", "esrgan")
hat_wood_metrics = evaluate(hat_pipeline, "trash_wood", "hat")
STAGE:2024-03-11 23:24:32 30539:143864 ActivityProfilerController.cpp:314] Completed Stage: Warm Up
Precision: 0.0
Recall: 0.0
Average IoU: 0.0
BENTHIC Model
------------------------------------- ------------ ------------ ------------ ------------ ------------ ------------ ------------ ------------
Name Self CPU % Self CPU CPU total % CPU total CPU time avg CPU Mem Self CPU Mem # of Calls
------------------------------------- ------------ ------------ ------------ ------------ ------------ ------------ ------------ ------------
aten::empty 0.00% 761.000us 0.00% 761.000us 2.606us 8.54 Gb 8.54 Gb 292
aten::cat 1.48% 373.154ms 1.48% 373.359ms 16.233ms 3.20 Gb 3.20 Gb 23
aten::add 0.23% 57.015ms 0.23% 57.020ms 647.955us 1.49 Gb 1.49 Gb 88
aten::sigmoid 0.38% 94.688ms 0.38% 94.688ms 31.563ms 1003.60 Mb 1003.60 Mb 3
aten::max_pool2d_with_indices 1.53% 385.242ms 1.53% 385.242ms 128.414ms 131.84 Mb 131.84 Mb 3
------------------------------------- ------------ ------------ ------------ ------------ ------------ ------------ ------------ ------------
Self CPU time total: 25.242s
STAGE:2024-03-11 23:24:57 30539:143864 ActivityProfilerController.cpp:320] Completed Stage: Collection STAGE:2024-03-11 23:24:57 30539:143864 ActivityProfilerController.cpp:324] Completed Stage: Post Processing STAGE:2024-03-11 23:24:58 30539:143864 ActivityProfilerController.cpp:314] Completed Stage: Warm Up
0%| | 0/20 [00:00<?, ?it/s]
Precision: 0.0
Recall: 0.0
Average IoU: 0.0
ABPN Model
------------------------------------- ------------ ------------ ------------ ------------ ------------ ------------ ------------ ------------
Name Self CPU % Self CPU CPU total % CPU total CPU time avg CPU Mem Self CPU Mem # of Calls
------------------------------------- ------------ ------------ ------------ ------------ ------------ ------------ ------------ ------------
aten::empty 0.00% 752.000us 0.00% 752.000us 2.541us 8.54 Gb 8.54 Gb 296
aten::cat 1.27% 326.029ms 1.27% 326.242ms 14.184ms 3.20 Gb 3.20 Gb 23
aten::add 0.21% 54.261ms 0.21% 54.267ms 616.670us 1.49 Gb 1.49 Gb 88
aten::sigmoid 0.36% 90.993ms 0.36% 90.993ms 30.331ms 1003.60 Mb 1003.60 Mb 3
aten::max_pool2d_with_indices 1.50% 382.867ms 1.50% 382.867ms 127.622ms 131.84 Mb 131.84 Mb 3
------------------------------------- ------------ ------------ ------------ ------------ ------------ ------------ ------------ ------------
Self CPU time total: 25.588s
STAGE:2024-03-11 23:25:25 30539:143864 ActivityProfilerController.cpp:320] Completed Stage: Collection STAGE:2024-03-11 23:25:25 30539:143864 ActivityProfilerController.cpp:324] Completed Stage: Post Processing STAGE:2024-03-11 23:25:25 30539:143864 ActivityProfilerController.cpp:314] Completed Stage: Warm Up
0%| | 0/20 [00:00<?, ?it/s]
Precision: 0.0 Recall: 0.0 Average IoU: tensor(0.08112) ESRGAN Model
STAGE:2024-03-11 23:26:23 30539:143864 ActivityProfilerController.cpp:320] Completed Stage: Collection STAGE:2024-03-11 23:26:23 30539:143864 ActivityProfilerController.cpp:324] Completed Stage: Post Processing
------------------------------------- ------------ ------------ ------------ ------------ ------------ ------------ ------------ ------------
Name Self CPU % Self CPU CPU total % CPU total CPU time avg CPU Mem Self CPU Mem # of Calls
------------------------------------- ------------ ------------ ------------ ------------ ------------ ------------ ------------ ------------
aten::empty 0.06% 35.889ms 0.06% 35.889ms 4.880us 8.48 Gb 8.48 Gb 7355
aten::cat 19.05% 10.780s 19.06% 10.780s 1.943ms 3.20 Gb 3.20 Gb 5548
aten::add 3.34% 1.889s 3.34% 1.889s 960.090us 1.49 Gb 1.49 Gb 1968
aten::sigmoid 0.17% 97.518ms 0.17% 97.518ms 32.506ms 1003.60 Mb 1003.60 Mb 3
aten::empty_strided 0.00% 647.000us 0.00% 647.000us 1.875us 482.52 Mb 482.52 Mb 345
------------------------------------- ------------ ------------ ------------ ------------ ------------ ------------ ------------ ------------
Self CPU time total: 56.571s
STAGE:2024-03-11 23:26:27 30539:143864 ActivityProfilerController.cpp:314] Completed Stage: Warm Up
0%| | 0/20 [00:00<?, ?it/s]
Precision: 0.0 Recall: 0.0 Average IoU: tensor(0.09752) HAT Model
STAGE:2024-03-11 23:29:50 30539:143864 ActivityProfilerController.cpp:320] Completed Stage: Collection STAGE:2024-03-11 23:29:50 30539:143864 ActivityProfilerController.cpp:324] Completed Stage: Post Processing
------------------------------------- ------------ ------------ ------------ ------------ ------------ ------------ ------------ ------------
Name Self CPU % Self CPU CPU total % CPU total CPU time avg CPU Mem Self CPU Mem # of Calls
------------------------------------- ------------ ------------ ------------ ------------ ------------ ------------ ------------ ------------
aten::empty 0.02% 49.865ms 0.02% 49.865ms 1.664us 28.86 Gb 28.86 Gb 29971
aten::resize_ 3.83% 7.725s 3.83% 7.725s 62.298ms 20.23 Gb 20.23 Gb 124
aten::empty_strided 0.00% 4.809ms 0.00% 4.809ms 7.820us 16.05 Gb 16.05 Gb 615
aten::cat 4.81% 9.703s 4.81% 9.706s 6.135ms 3.20 Gb 3.20 Gb 1582
aten::sub 0.41% 829.572ms 0.41% 829.781ms 7.543ms 1.92 Gb 1.92 Gb 110
------------------------------------- ------------ ------------ ------------ ------------ ------------ ------------ ------------ ------------
Self CPU time total: 201.674s
Results
Animals categories
| Model | Category | Precision | Recall | Average IoU | Elapsed time | Peak memory |
|---|---|---|---|---|---|---|
| Basic | Crab | 0.0 | 0.00 | 0.0 | 25.53 s | 8.54 Gb |
| ABPN | Crab | 0.0133 | 0.0115 | 0.0104 | 25.69 s | 8.54 Gb |
| ESRGAN | Crab | 0.0087 | 0.0115 | 0.0092 | 54.50 s | 8.54 Gb |
| HAT | Crab | 0.1111 | 0.0230 | 0.1018 | 166.85 s | 26.07 Gb |
| Basic | Eel | 0.0 | 0.0 | 0.0 | 21.52 s | 6.95 Gb |
| ABPN | Eel | 0.0 | 0.0 | 0.0 | 21.43 s | 6.95 Gb |
| ESRGAN | Eel | 0.2857 | 0.0833 | 0.2197 | 45.91 s | 6.95 Gb |
| HAT | Eel | 0.3636 | 0.0833 | 0.2739 | 114.02 s | 20.02 Gb |
| Basic | Fish | 0.0 | 0.0 | 0.0 | 25.51 s | 8.49 Gb |
| ABPN | Fish | 0.3333 | 0.0339 | 0.2662 | 25.92 s | 8.54 Gb |
| ESRGAN | Fish | 0.1667 | 0.0339 | 0.1354 | 52.82 s | 8.34 Gb |
| HAT | Fish | 0.5000 | 0.0508 | 0.3851 | 151.14 s | 24.00 Gb |
| Basic | Shell | 0.0 | 0.0 | 0.0 | 25.55 s | 8.35 Gb |
| ABPN | Shell | 0.0 | 0.0 | 0.0 | 26.00 s | 8.54 Gb |
| ESRGAN | Shell | 0.0 | 0.0 | 0.0 | 52.72 s | 8.54 Gb |
| HAT | Shell | 0.0 | 0.0 | 0.0 | 150.23 s | 23.55 Gb |
| Basic | Starfish | 0.3720 | 0.0792 | 0.2956 | 46.45 s | - |
| ABPN | Starfish | 0.2031 | 0.0643 | 0.1501 | 52.09 s | - |
| ESRGAN | Starfish | 0.2142 | 0.0891 | 0.1784 | 108.12 s | - |
| HAT | Starfish | 0.4347 | 0.0990 | 0.3460 | 377.19 s | - |
Trash categories
| Model | Category | Precision | Recall | Average IoU | Elapsed time | Peak Memory |
|---|---|---|---|---|---|---|
| Basic | Metal | 0.0 | 0.0 | 0.0 | 26.07 s | 8.54 Gb |
| ABPN | Metal | 0.0 | 0.0 | 0.0 | 25.66 s | 8.54 Gb |
| ESRGAN | Metal | 0.0 | 0.0 | 0.0 | 52.92 s | 8.35 Gb |
| HAT | Metal | 0.2000 | 0.0161 | 0.1695 | 143.19 s | 23.48 Gb |
| Basic | Trash | 0.0 | 0.0 | 0.0 | 25.42 s | 8.54 Gb |
| ABPN | Trash | 0.0357 | 0.0141 | 0.0266 | 26.40 s | 8.51 Gb |
| ESRGAN | Trash | 0.2500 | 0.0140 | 0.1860 | 54.68 s | 8.53 Gb |
| HAT | Trash | 0.2857 | 0.0282 | 0.2066 | 152.13 s | 23.48 Gb |
| Basic | Wood | 0.0 | 0.0 | 0.0 | 25.24 s | 8.54 Gb |
| ABPN | Wood | 0.0 | 0.0 | 0.0 | 25.59 s | 8.54 Gb |
| ESRGAN | Wood | 0.0 | 0.0 | 0.0 | 56.71 s | 8.48 Gb |
| HAT | Wood | 0.0 | 0.0 | 0.0 | 201.67 s | 28.86 Gb |
Averaged metrics
Mean of each of our metrics for the evaluated categories.
| Model | mAP | Macro average IoU | Average time | Average Memory |
|---|---|---|---|---|
| Basic | 0.0465 | 0.0370 | 27.66 s | 8.279 Gb |
| ABPN | 0.0881 | 0.0567 | 28.60 s | 8.309 Gb |
| ESRGAN | 0.1157 | 0.0911 | 59.80 s | 8.247 Gb |
| HAT | 0.2369 | 0.1854 | 182.05 s | 24.21 Gb |
Analysis
We found that our HAT pipeline performed best for all categories, and had the highest mAP score.
Categories like Fish and Eel were quite interesting, since here the Benthic Object Detector alone did not find any of the expected labels, yet was able to when using any of our SR heads.
This strengthens our hypothesis that model performance can be increased without any fine tuning, by simply adding a super-resolution layer to the input images.
Despite its high performance, the HAT pipeline was also the slowest of the three SR models tested, taking about 5 times longer than the basic model to process the images. It also required up to 3x more space in peak memory. This computation burden limits the applicability of the HAT model in real-time applications, unless a GPU is available. The large jumps in performance, however, open for the possiblity to find dig further into more light-weight transformer models, to potentially find the sweet spot of computational cost and performance.
The ESRGAN pipeline did an ok job at increasing performance in some categoies, improving overall mAP score by almost 3 times in comparison to the basic model. However, given that this pipeline was twice as slow as the ABPN model, with only about 1.5 times better mAP performance, this pipeline may be less attractive for real-time applications. One positive thing to mention here was that ESRGAN's peak memory was on average the lowest of all of our models. This sparks the question about potential for SR models to actually lower resources in systems where every FLOP counts. Even though this pipeline was much faster and required much less memory than HAT, its performance (when not fine-tuned) was subpar in comparison.
The ABPN pipeline was the fastest of the three SR models, taking on average a bit less than a second more than the basic model to process the 20 evalaution images. The performance of the model was not as good as the HAT or ESRGAN models, but twice as good as the basic model. So even though it did not perform amazingly, quantized models like ABPN should definitely be looked further into, especially if fine-tuned to our domain.
Another insight we noticed in the data wass that recall is generally low, meaning the model is very underfit for these data. This makes total sense, since we are using models trained on different datasets, with different annotation quality and detail. The fact that we were able to improve precision in some categories, however, shows great promise in such set-ups.
We should also note that the results found here are only the first step in a model selection process. There is a chance that low performing models like ESRGAN or even the Benthic Object Detector itself could improve with fine-tuning on our TrashCAN dataset. Finally, a more thorough evaluation of the models would require using a larger evaluation dataset.
Conclusion
We saw that all of our untuned SR models helped increase performance for the Benthic Object Detector to a level better then what the model was able to do on its own. The HAT model was the best performing model, yet also the slowest and most memory intensive. Out of our two full sized SR models, ESRGAN gave the worse performance on our evaluation metrics, but was also the most memory efficient, relying rather on many residual connections rather than large matrix multiplications. The ABPN model was the fastest of the three SR models, and gave slightly better performance than the ESRGAN model, yet not as good as the HAT model.
Future work
This baseline study serves as a great starting point for future research, where we can look into fine-tuning the models to our specific dataset. Some inpirations and ideas we came up with for future work, when developing this notebook were:
- Fine-tuning
- add extra final output layer to MBARI model mapping 691 outputs to 17 TrashCAN labels
- fine-tune the model on the TrashCAN dataset and evaluate results
- select iamges from FathomNet that have annotations for the TrashCAN labels
- fine-tune the model on the FathomNet images and evaluate results
- Deeper compare analysis
- compare the performance of the super-resolution models on the FathomNet dataset
- Manually observe annotations from TrashCAN and FathomNet to empirically evaluate quality
- Compare on a larger portion of the TrashCAN dataset
- More research
- Is there a light-weight Transformer SR model that can compete with ABPN?
- Can we actually speed up performance using an SR model?
Comments on implementation
We stripped down all our implementations to the bare minimum, for readability and ease of use and understanding. To do so, we wrote rewrote some of the code included in the original implementations of the SR models. This gave us the flexibility to make adjustments where we saw fit, and helped get an understanding of some fo the inner workings of the models. If we were to scale this workflow up to consume much more data there are a few important things that should be changed:
- When upsampling the images, it would be a good idea to save the outputs to disk, to avoid having too much memory in use at once, and allow for async/batched inference. We could store and overwrite SR outputs from a batch in a temporary folder, and then tear down when training/evaluation is done.
- When possible, we should try to reuse code from the original implementation. This would allow us to make use of the original model's documentation and community support, and potentially help contribute to the original projcets if we find any bugs or improvements.
- We could also look into using a more efficient way to store the images in memory, such as using a
torch.utils.data.Datasetandtorch.utils.data.DataLoaderto load the images in batches. This would allow us to use the GPU more efficiently, and also allow for async/batched inference. - Enabling the use of a GPU would also greatly speed up the inference time of the models.
- Our final evaluation was only done on 20 images per category. This is a small sample size, but gives us an idea as to how the models will perform on the full dataset. Evaluating on a larger portion of the data should be done on faster hardware, to avoid too long runtimes.
Up next: Multi-object tracking
In the next blogpost, we will look into multi-object tracking, where we will track the objects detected by the Benthic Object Detector over time. There, we will give a breif introduction to the problem, along with some of the fundamental concepts and methods used in the field. We will also explore some state-of-the-art trackers, along with implementing some of them.